Wolf Richter wolfstreet.com, www.amazon.com/author/wolfrichter
Vancouver has tiny uptick after 14 declines. Toronto dips below July 2017 peak. Victoria ekes out new high. Calgary, Edmonton stuck below oil-boom peaks years ago. Quebec City flat for 6 years. Montreal ticks down from high. Ottawa ekes out new high but remains low.
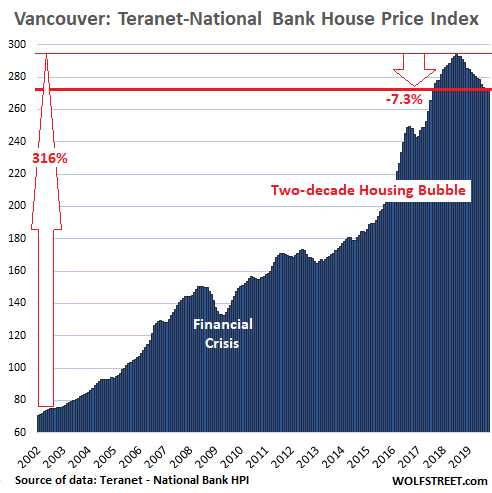
House prices in Greater Vancouver ticked up 0.2% in October from September, the first monthly increase after 14 month-to-month declines in a row. Prices were down 7.3% from the peak last July, and down 6.2% from October last year, and are about where they’d first been in August 2017, according to the Teranet-National Bank National House Price Index.
How big was the bubble that was considered one of the world’s hottest housing bubbles? Over the 16-year boom from January 2002 through the peak in July 2018, house prices in the Vancouver metro had more than quadrupled:
Toronto:
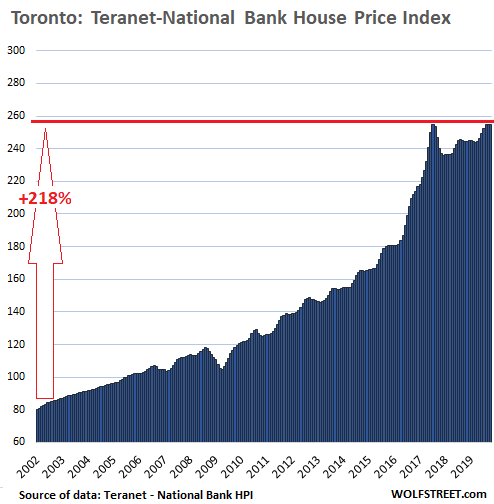
Unlike Vancouver, which had its first month-to-month up-tick after 14 months of declines, house prices in the Greater Toronto Area had their first month-to-month down-tick after six monthly increases in a row. In October, house prices ticked down 0.2% from September and thereby slipped 0.1% below the prior peak in July 2017.
In the GTA, house prices had more than tripled (+218%) since 2002, but that was practically lame compared to Vancouver’s more than quadrupling over the period (+316%). Toronto’s chart and the charts of the other markets below are on the same scale as Vancouver’s chart. This shows the house price changes in each metro in proportion to each other, and you see more white space as we go down the list. It also shows just how diverse Canadian housing markets are.
The Teranet-National Bank House Price Index tracks price changes of single-family houses via “sales pairs”: The price of a house that sold in the current month is compared to the price of the same house when it sold previously, often years ago (methodology). This method eliminates the issues with median prices where changes in the “mix” can skew the index; and it eliminates the issues with average prices, where a few big outliers can skew the index.
Victoria:
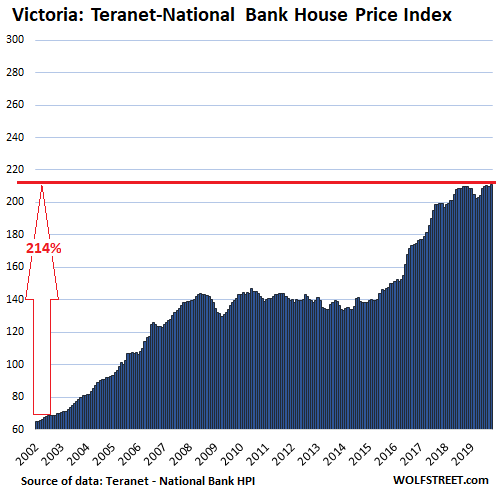
In Victoria, house prices, which have more than tripled since January 2002 (+224%), rose 0.7% in October from September, and reached a new record, but only 0.7% from a year ago, with the index being essentially flat for 13 months with a dip in the middle:
Winnipeg:
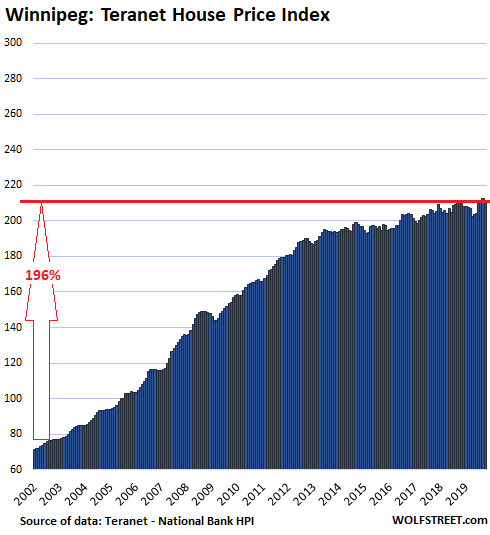
House prices in the Winnipeg metro declined 0.4% in October from September and are up just 0.3% from October last year. The index had nearly tripled between 2002 and September 2014, as if Winnipeg was going to run out of land or something. Since 2014, after it was inadvertently discovered that the metro wouldn’t run out of land, the curve has flattened out:
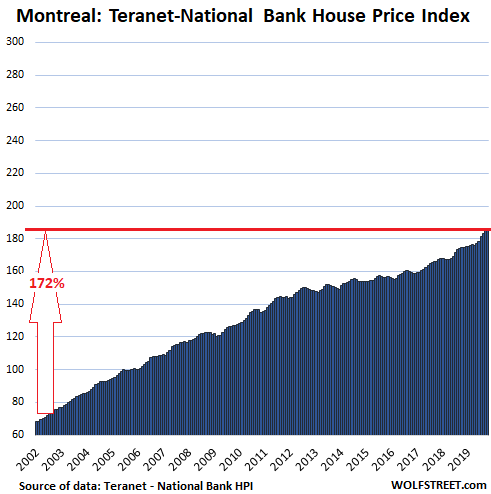
Montreal:
House prices in Montreal inched down 1.0% in October from September, which had been a record, and were up 6.0% year-over-year. The index has risen 172% since 2002, at a steady pace that not even the Financial Crisis could trip up. But the sharper pace of increases earlier this year has now come to a halt:
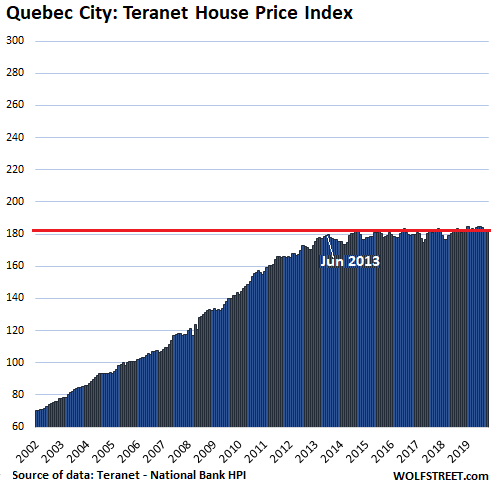
Quebec City:
House prices in the Quebec City metro ticked up 0.1% in October from September but were down 1.1% from the peak in July, and have been essentially flat since June 2013, after a mind-bending jump of 160% in the prior 12 years:
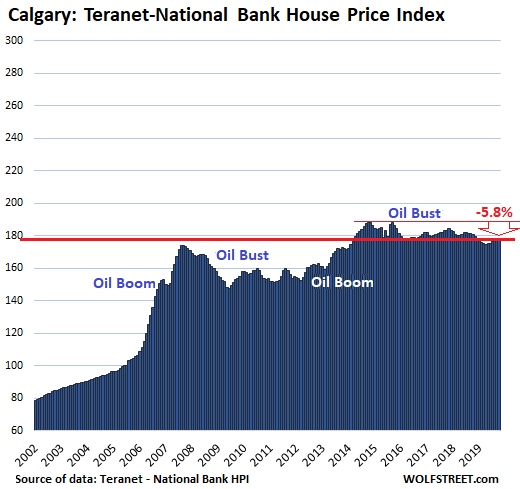
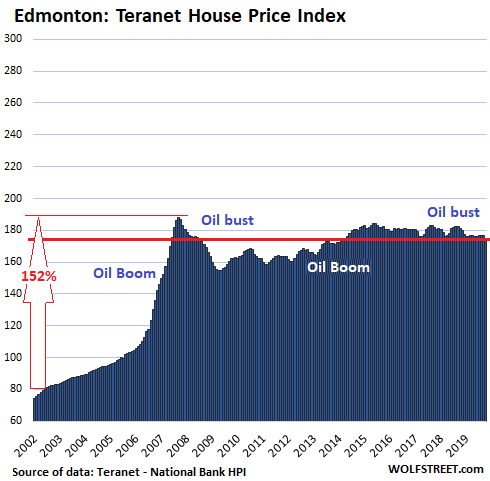
Oil Boom-and-Bust Towns Calgary and Edmonton:
In these two cities, oil booms and busts determine house prices. During oil booms, the housing market goes into party mode, but then the hangovers last many years. Over the two years during the oil boom before the Financial Crisis, the index for Calgary skyrocketed 78% and for Edmonton 87%. Then came the oil bust, which then cycled into a boom, after which came the next bust, namely now.
In Calgary, house prices ticked down 0.1% in October from September, and are down 1.7% from a year ago, and down 5.8% from the peak in October 2014:
In Edmonton, house prices fell 1.0% in October from September and were down 3.4% year-over-year and down 6.9% from the mind-blowing peak in October 2007, which was exactly 12 years ago:
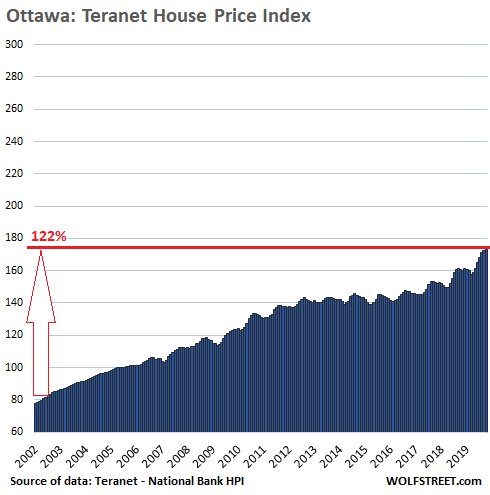
Ottawa:
The house price index for Ottawa ticked up 0.2% in October from September to a new record, and are up 7.7% year-over-year. Since January 2002, the House Price Index has risen 120%, which is a substantial increase by any measure, but compared to Canada’s other housing markets, Ottawa ranks in last place on this list in terms of price gains since 2002:
It’s just house-price inflation
The Teranet-National Bank National House Price Index tracks how many more Canadian dollars it takes to buy the same house over time via its “sales pair” method. When the price of the same house doubles over the years, it’s not because the house doubles in size, or become twice as opulent, but because the purchasing power of the Canadian dollar has declined, and it takes twice as many dollars to buy the same house. This “sales pair” method makes the index, and indices such as CoreLogic Case-Shiller Home Price Index for the US, a measure of local house price inflation, which is what is pictured in the charts above.
Despite startup millionaires, house and condo prices in the San Francisco Bay Area and condo prices in New York City fall from a year ago. Seattle house prices fell again. Los Angeles, Las Vegas lost steam. Phoenix, others ran hot. Read… The Most Splendid Housing Bubbles in America, October Update