via Carl Swenlin
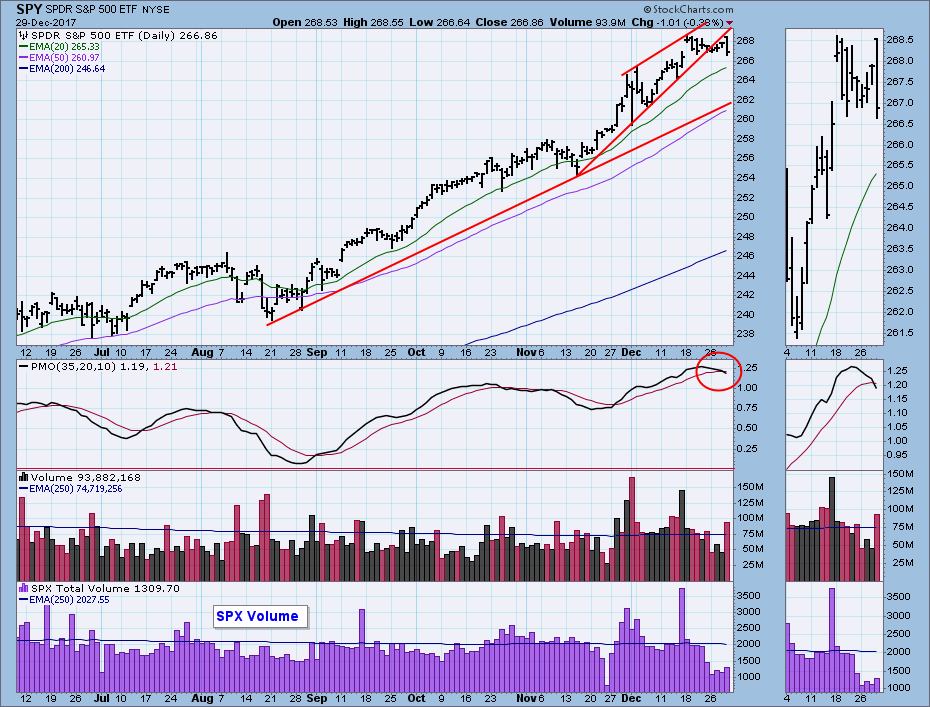
Last week we were looking at a rising wedge formation, which we said normally resolves downward. This week price moved through the bottom of the wedge sideways, but that doesn’t really qualify as a downward resolution, which would necessarily require price to move, well, down. Friday’s price bar does convey a small burst of downward energy, but the two-week trading range remains intact. Regardless of our expectations the market still didn’t seem inclined to give up any ground. That could have something to do with the new tax bill — investors waiting to take capital gains in 2018, when tax rates are more favorable.
The DecisionPoint Weekly Wrap presents an end-of-week assessment of the trend and condition of the stock market (S&P 500), the U.S. Dollar, Gold, Crude Oil, and Bonds.
STOCKS
IT Trend Model: BUY as of 11/15/2016
LT Trend Model: BUY as of 4/1/2016
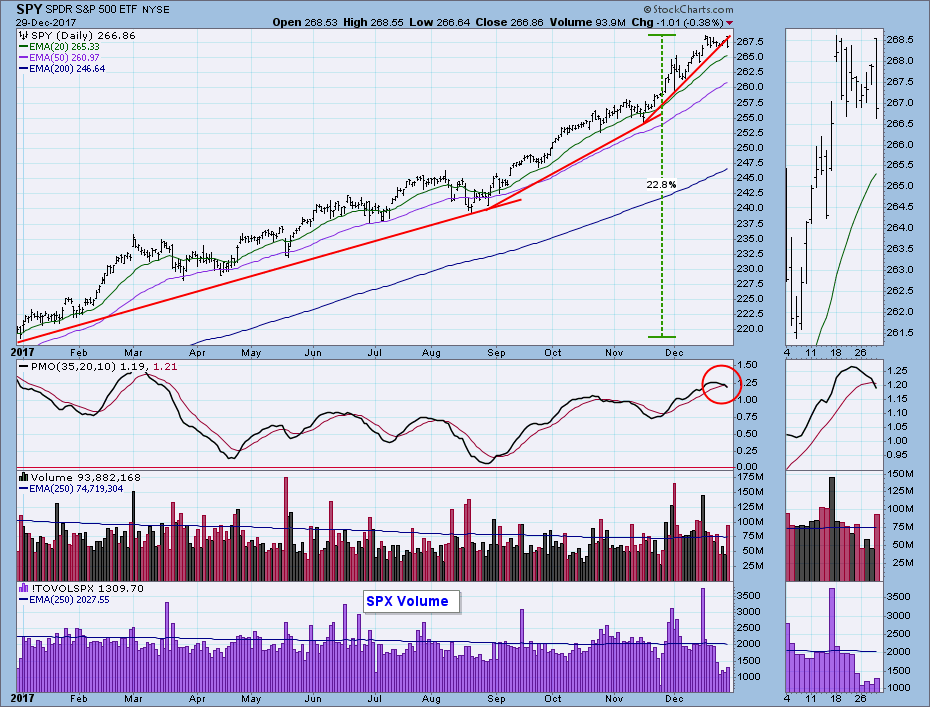
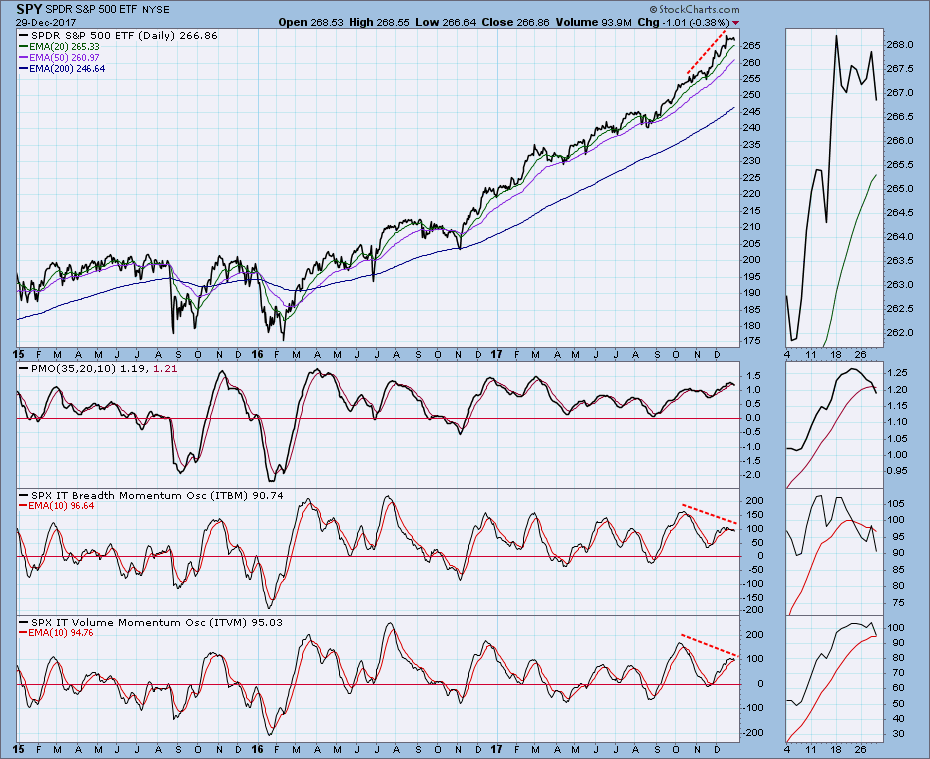
Daily Chart: It’s always a bonus when the end of the week, month and year all occur on the same day, because we get to look at daily, weekly, and monthly charts together. The one-year daily chart shows that SPY advanced about +23% in 2017. We can also see the three ever-steepening trend lines that tell us that a parabolic price rise is in progress. On Friday the trend line was broken, and the daily PMO, having topped earlier in the week, crossed down through the signal line.
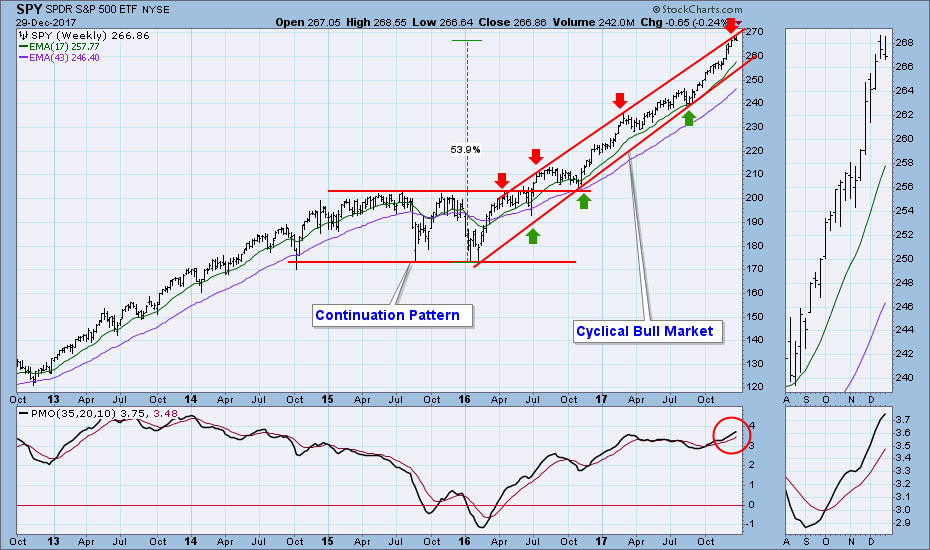
Weekly Chart: The fact that price has reached the top of a long rising trend channel is a strong piece of evidence pointing toward the probability of a correction, but, looking at three prior tops in that channel, we can see that there are possible scenarios where pain would be minimized.
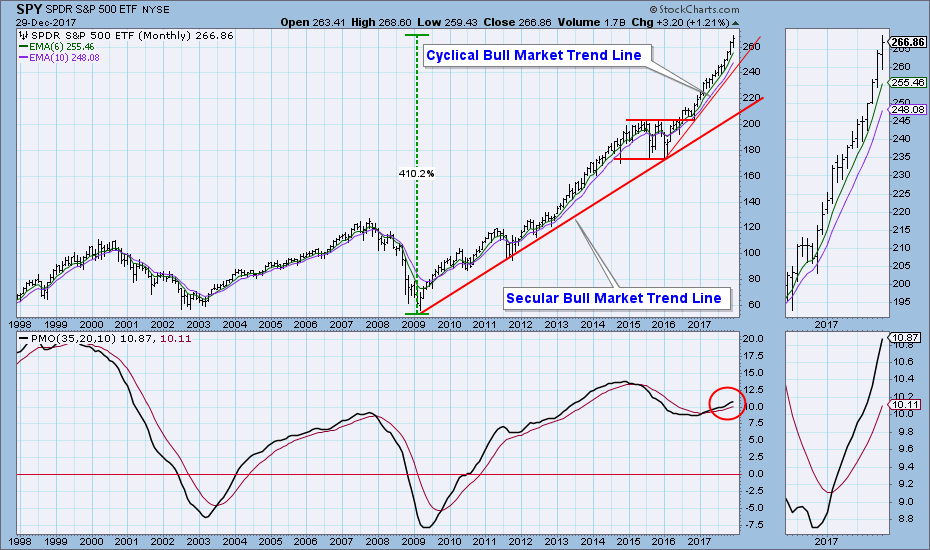
Monthly Chart: In this time frame we get to look at the secular bull market, which began in early-2009 and in nine years has advanced +410%. What concerns me on the monthly chart is the massive upside departure price has made from the nine-year rising trend line, and I get the definite impression that price has entered a parabolic zoom. This can’t last.
Short-Term Market Indicators: The negative divergences persist, and these indicators are neutral, not oversold.
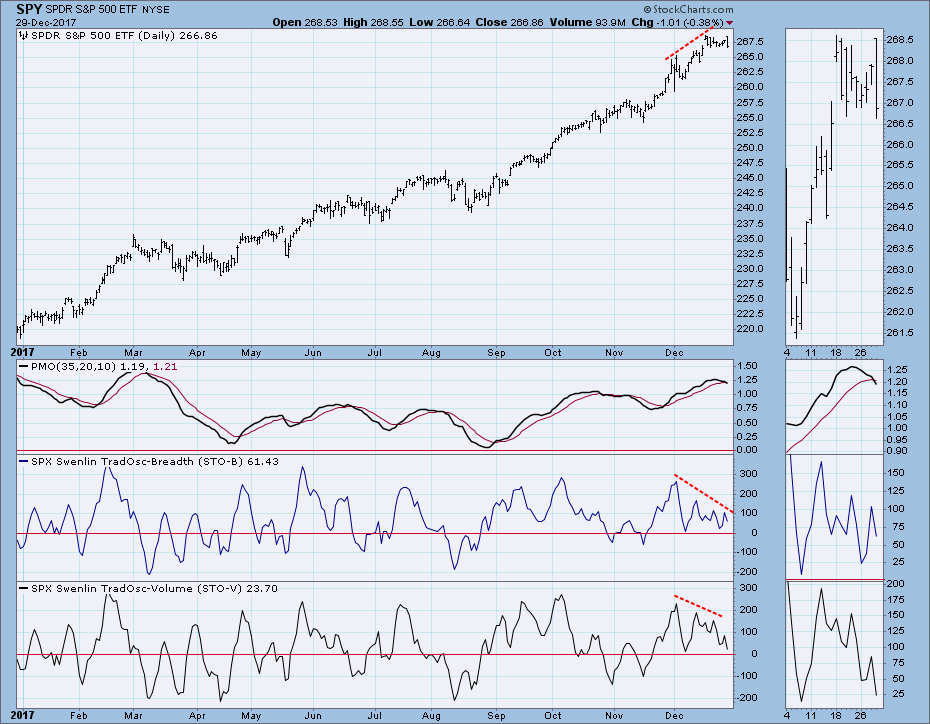
Intermediate-Term Market Indicators: Negative divergences persist, and two indicators have crossed down through their signal lines. The ITVM has lagged, I think, because of low holiday volume. Plenty of room for a correction.
Conclusion: Positive fundamental events keep rolling out, infusing investors with confidence; however, the P/E for the S&P 500 Index is a rich 25, and that needs to be corrected. The SPY monthly and weekly charts show how overbought the market is relative to the major rising trend lines, and this is my greatest concern in the intermediate-term, technically speaking. The market is overvalued and overbought, and 2018’s lower tax rates will provide the opportunity to take some profits. I think that a correction is likely to begin next week.