via Ivan Martchev
I thought of Prince’s song before I sat down to write this column as the stock market is truly “partying like it’s 1999.” The stock market bolted out of the gates in 2018 amid signs of investor euphoria that are hard to ignore. The options market is showing a skew towards call buying that typically means the herd is astoundingly bullish. The trouble is that such skews in sentiment are generally viewed as contrarian.
Graphs are for illustrative and discussion purposes only. Please read important disclosures at the end of this commentary.
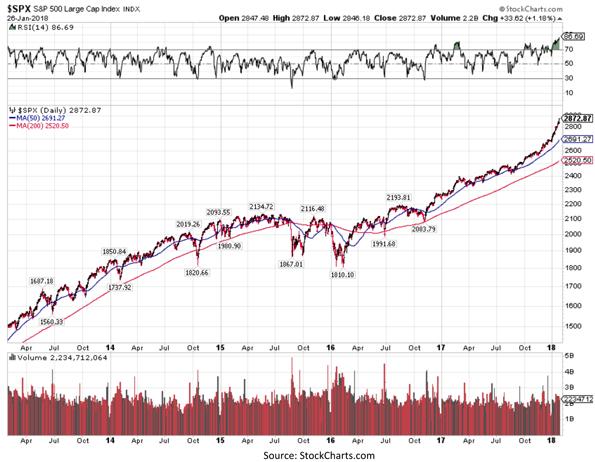
If one looks at the index tracked by the largest amount of assets in the U.S. – the S&P 500 – one would see that the price chart is moving away from its 50- and 200-day moving averages and almost trying to “curve backwards,” suggesting an unsustainable rate of change. A more sustainable trend is one where the index “backs and fills” and generally hugs its 50-day moving average and occasionally dips towards its 200-day moving average. We have not touched the 50-day moving average in five months and we have not touched the 200-day moving average since the November 2016 election.
Typically, as the economic cycle ages, the economy slows down. As the bull market in stocks ages it tends to narrow. We are experiencing exactly the opposite now. The economy seems to have picked up while the stock market has broadened and accelerated.
I would agree that some of that has to do with the tax overhaul passed by Congress at the end of 2017, but it also has to do with a more vibrant global economy. Be that as it may, the last thing a bull wants to see is for an index to go parabolic right in the middle of a Fed tightening cycle. The last time we had the phenomenon of stocks rising sharply as the Federal Reserve was hiking interest rates at the end of a long economic cycle was the year 2000. We didn’t know it at the time, but this was the end of the longest economic expansion in U.S. history that lasted from March 1991 to March 2001.
How parabolic is the stock market at the moment? Extremely so.
If one looks at a popular overbought/oversold indicator like the Relative Strength Index (RSI) on the S&P 500, one would see a daily reading of 86.69, which is a reading we have not seen in over 20 years. RSI varies between 0 and 100. For a detailed explanation, you can see a glossary in www.stockcharts.com)
Excerpt: “Assuming a 14-period RSI, a zero RSI value means prices moved lower all 14 periods. There were no gains to measure. RSI is 100 when the Average Loss equals zero. This means prices moved higher all 14 periods. There were no losses to measure.”
A reading of 86.69 for the S&P 500 means the index was up the vast majority of the past 14 days. The magnitude of how much the index was up also matters, so this type of reading on a popular oscillator like RSI becomes extremely rare. One can look at RSI on a weekly basis and get similar extreme readings.
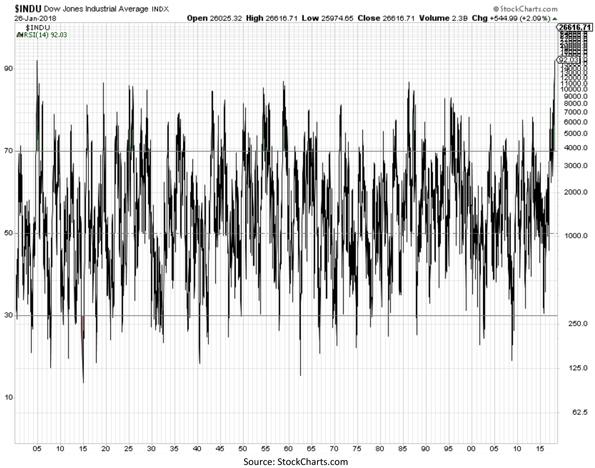
Since the Dow Industrial Average is an index with longer history than the S&P 500, I pulled the weekly readings of RSI for the Dow and removed the index chart in order to better see the indicator values.
Here is the result.
Graphs are for illustrative and discussion purposes only. Please read important disclosures at the end of this commentary.
With a weekly 14-period RSI reading of 92.03, the Dow has not had similar reading since 1904. Given that the Dow Jones Industrial Average first appeared in the Wall Street Journal in 1896 and Charles Dow began work on the index in 1884, this type of extreme reading is a once-in-a-lifetime type of event.
All of the above does not mean that a market crash is imminent, but it does put things in perspective as one considers what to do next. Being very overbought in the stock market simply means that the prudent thing to do is focus as much on defense as offense and pay close attention to leading economic indicators.
TREASURIES TO GET MORE VOLATILE
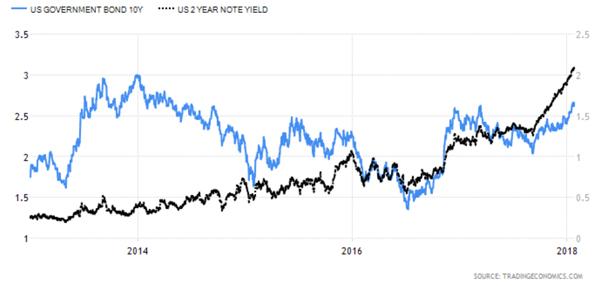
It is about a week before the new Fed Chairman Jerome Powell takes over and things couldn’t look better for the new Chairman. Unemployment is low and the stock market is “partying like it’s 1999.” As the stock market is climbing, interest rates are climbing too, with the 2-year yield on fire, well above 2%, and the 10-year Treasury yield rising to the highest point since 2014.
Graphs are for illustrative and discussion purposes only. Please read important disclosures at the end of this commentary.
Since the Fed is slated to up the pace of quantitative tightening and deliver up to four fed funds rate hikes this year, I would expect volatility in the bond market to pick up dramatically and to see that increased volatility reflected in the stock market.
Remember what happened to bonds when then-Chairman Ben Bernanke issued the word “taper” in May 2013? We should see similar volatility in bonds particularly as the monthly runoff of the Fed’s balance sheet rate increases from the present rate of $10 billion.
The markets have an uncanny way to test new Fed Chairmen. The only recent Chairperson that was not truly tested by either the stock or bond markets was Janet Yellen. Given that the QT operation is slated to intensify in 2018, I think Jerome Powell will find out that the Fed Chairman’s seat will get hot pretty fast.