- Government Shuts Down
- What Does This Have To Do With The Markets
- Sector & Market Analysis
- 401k Plan Manager
Follow Us On: Twitter, Facebook, Linked-In, Sound Cloud, Seeking Alpha
It’s A Shutdown….
I am traveling this weekend but wanted to put out a short update on the market.
On Friday, the Senate failed to reach a comprise necessary to pass a 30-day “continuing resolution,” or “C.R.” in order to keep the Government funded.
Let me clarify something about “continuing resolutions.”
The government has been operating without a budget since 2009. Instead of passing a budget, Congress has opted to forgo the silly process of legislative procedure to effectively just operate the government with a “blank check.”
Incredible.
Over the past 9-years, the Government has gone from passing “C.R.’s” that would fund the Government for the remaining fiscal year, or longer, to just 30-days currently.
So, if Congress is engaged in partisan conflict every 30-days to keep the Government funded, exactly how are you supposed to move other legislative agenda forward?
But here is what you probably don’t know about “C.R.’s.” While it is TRUE that each C.R. passed maintains the current level of spending from the last “budget” that was passed; the level of spending is “automatically” increased by 8% annually.
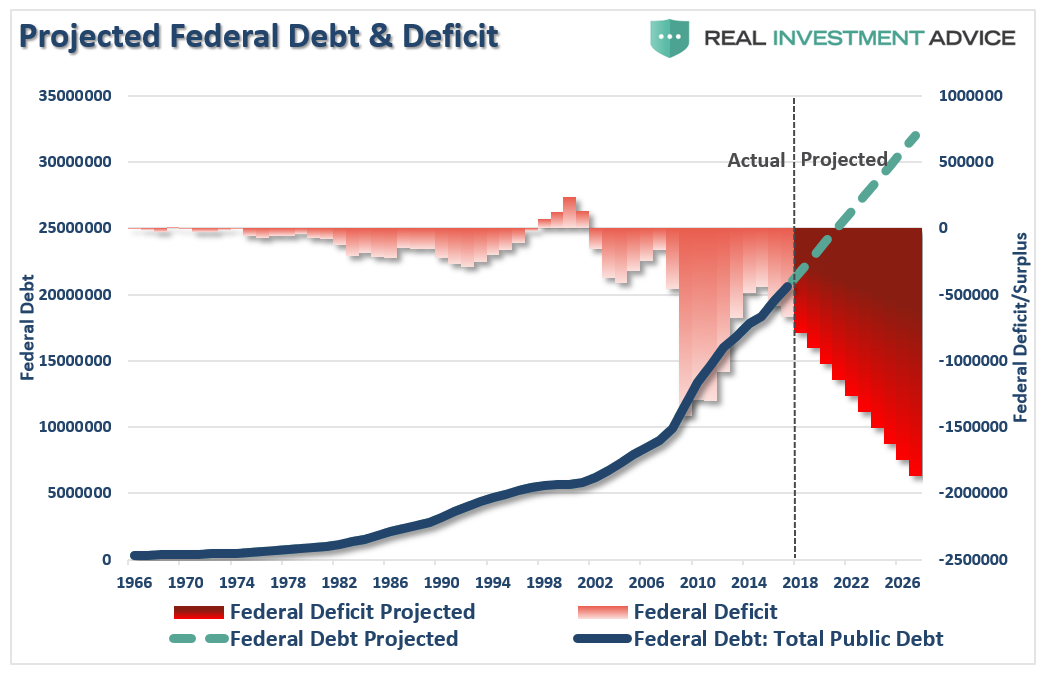
So, yes, while the Government will claim they are spending the same amount as they did in 2009, it is actually double that level due to the automatic increases. Of course, given that spending has continued to increase unabated, it is not surprising the U.S. continues to carry a rather large deficit between income and expenditures which is projected to get markedly worse.
But therein lies a problem.
As I discussed previously with the Chairman of the Financial Ways & Means Committee, Congressman Kevin Brady, while tax reform is expected to benefit the U.S. economy, tax reform without reductions in government spending will effectively nullify the reform effort from an economic growth perspective.
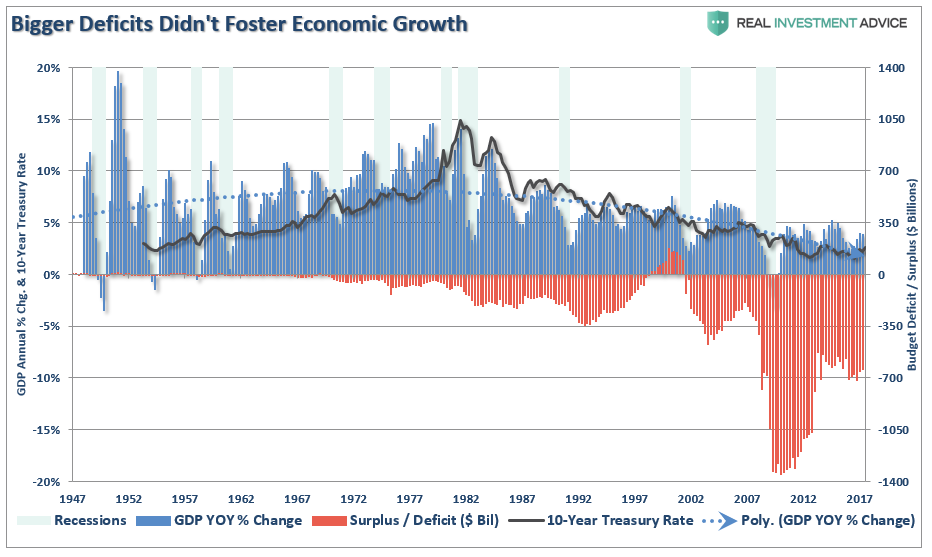
Congressman Brady is correct as there is absolutely NO historical evidence that cutting taxes, without offsetting cuts to spending, leads to stronger economic growth.
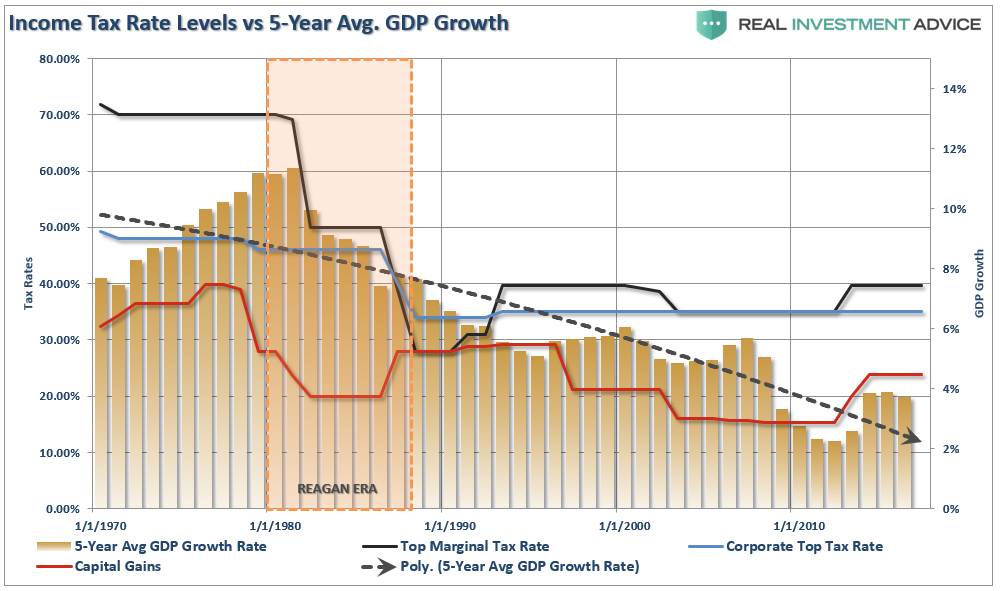
As debt continues to mount, the reduction in tax revenues from tax reform will lead to greater deficits which ultimately impedes economic growth.
The spending problem is potentially grossly compounded if interest rates do actually rise as the amount of interest paid on the debt rises sharply. Currently, the Government pays about $525 billion a year in interest payments on its debt – each 1% rise in interest rates adds $210 Billion to that payment.

While the “Shutdown” will be very short-lived, as they always are, the reality is that whatever “C.R.” comes out it will only further increase our spending and, ultimately, our debt and deficits.
What Does This Have To Do With The Markets?
Nothing at the moment.
But it eventually will.
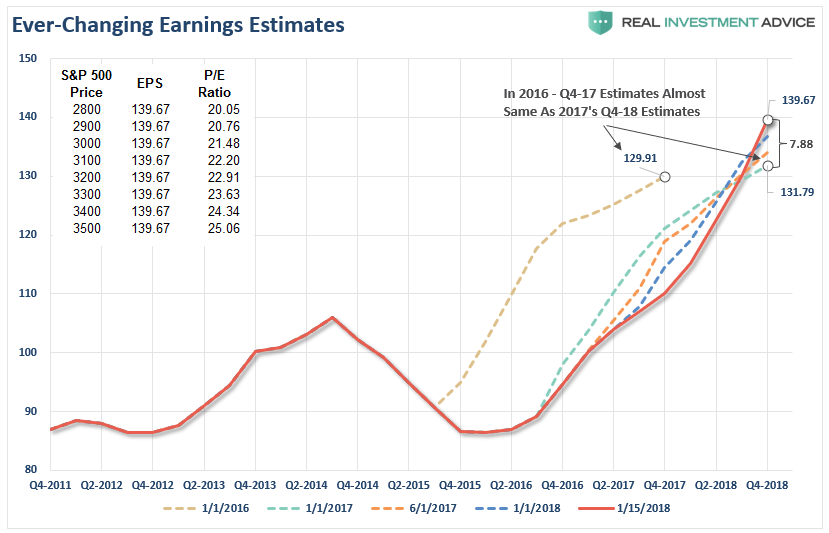
Over the last week, the run-up in the financial markets continued as Wall Street rapidly ratcheted earnings estimates for 2018 and 2019 based on the expected benefit from the recently passed tax reform legislation.
Currently, the only thing that matters to the market is the boost to earnings from tax reform in the coming year.
Just remember, that boost to earnings is only good for the 1st year.
More importantly, even if the current level of estimates are hit for the end of 2018, the current price advance in the market still remains well elevated above historic norms.
Only at current levels does valuation get reduced as the “E” catches up with the “P.” If investors continue to push asset prices higher, and faster than the rate of earnings growth currently, valuations remain elevated at historically high levels.
As I addressed last week in “Has Tax Reform Been Priced In,” at 2800 on the S&P 500, the improvement of earnings has already been priced in. Therefore, any disappointment in earnings growth will send valuations even further into “bubble” territory. Since Wall Street has a long history of always “over-estimating” earnings growth by 33%, the risk of disappointment to investors is very high.
Notice that already the expected benefit of tax reform is already being reduced in just the first two-weeks of this year. While year-end 2018 reamins elevated, estimates for front-end quarters are already being reigned in. “Hope floats.”
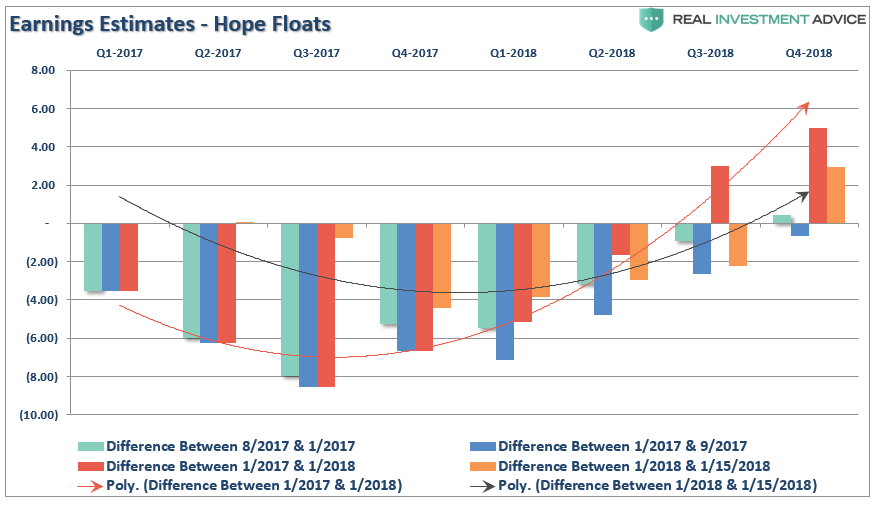
Given that over the long-term there is a direct correlation between earnings and economic growth, further downward adjustments to estimates should be expected. This only makes sense since the companies that make up the stock market are a reflection of economic activity.
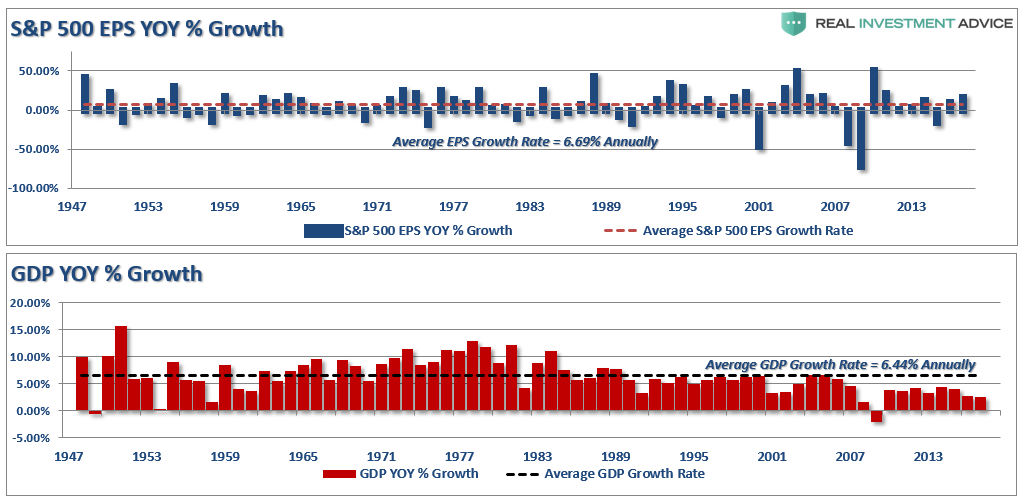
In 2019 Wall Street will once again begin comparing expected earnings growth to 2018. Immediately, earnings growth will revert to a reflection of expected economic growth. Given the lack of offsets by Congress to reduce the current expansion of debt, the small bump to economic growth in 2018 will likely recede back to longer-term trends of 2.1-2.3% annually.
Ultimately, investors will care about valuations.
For now, it is hoped that historically high levels of stock valuations will be reduced by an explosion in underlying earnings growth due to the impact of tax reform.
While exuberance is currently “off the charts” bullish, and our portfolios remain inherently long in the meantime, we are extremely cognizant of the risk of something “breaking.”
It is what always happens.
Yes, currently, everything is absolutely, positively, optimistic. Economic growth has picked up over the last couple of quarters due to an unprecedented level of natural disasters, oil prices have risen boosting production and corporate earnings, and employment is at historically high levels if you don’t count those out of the labor force.
The positive backdrop for stocks could not be currently better.
Just remember, “bull markets” don’t die of pessimism – they die from excess optimism.
Currently, investors are more optimistic than at virtually any other point in history.
See you next week.
Market & Sector Analysis
Data Analysis Of The Market & Sectors For Traders
S&P 500 Tear Sheet

Performance Analysis

ETF Model Relative Performance Analysis
Sector & Market Analysis:
I discussed last week the ongoing setup for a “risk off” sector rotation. To wit:
“Well, here we are once again, and while not as dramatic of a deviation between outperforming sectors and underperforming, the same setup once again exists.”
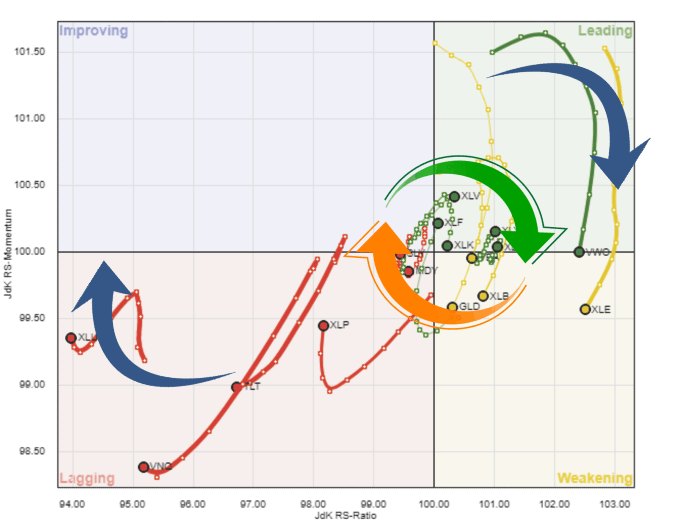
“However, for now…the bulls remain clearly in control. So, this is not yet the time to be overwhelming ‘bearish’ on the market.
But don’t disregard the risk, either.”
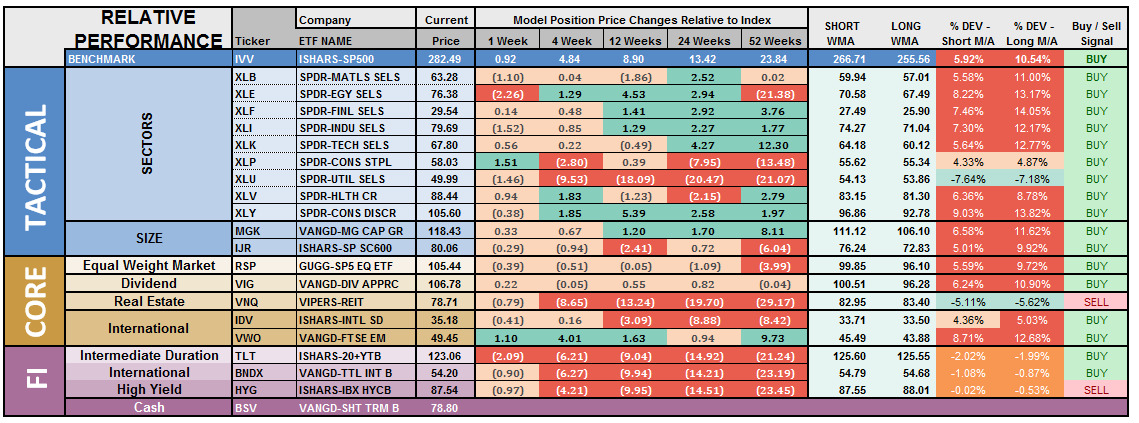
Notice the very tight rotation of sectors right around the performance of the S&P itself. Like the “eye of a storm,” this very fast rotation is of assets makes it very difficult to manage portfolios currently. This is why investors simply “feel” like they should just “buy and hold on.”
I get it, but it is very dangerous and something usually seen at very late stage advances.
Take a look at the sectors below. Every sector is pushing 2- and 3-standard deviations of longer-term moving averages.
This isn’t normal.
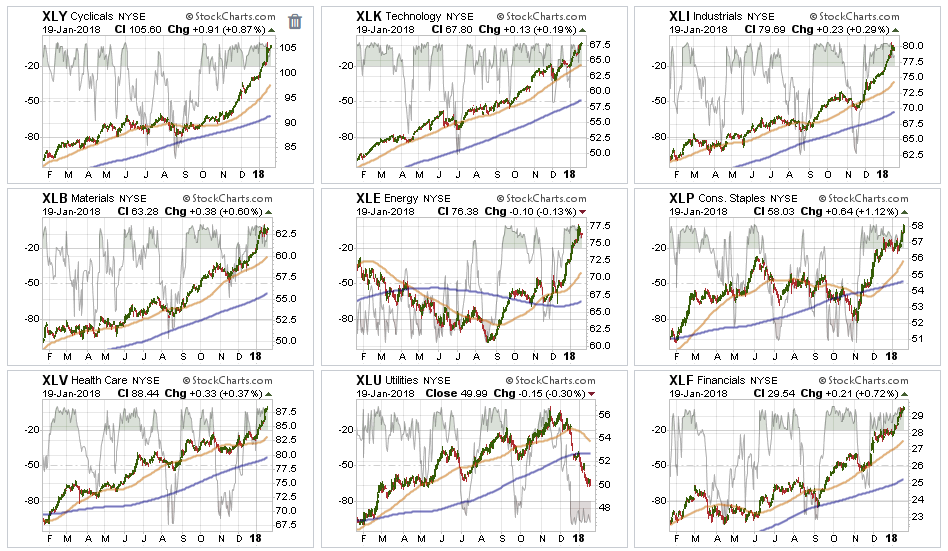
Every Sector Except Utilities – were in full-fledged party mode over the last week with Staples catching up to the party as the chase higher continues. The massive overbought conditions in every sector, again except Utilities, needs to be reduced before a better entry opportunity will present itself. We are still long our positions but continue to hedge risk and rebalance opportunistically.

Small and Mid-Cap index trends are positive which keeps allocations in the markets but the extreme overbought conditions make adding exposure here riskier. Look for weakness to take profits and rebalance weights in portfolios.
Emerging Markets and International Stocks as noted below, we added some international exposure on the breakout following the recent pullback. The markets are extremely overbought on every front, so, as with virtually every other position, rebalancing portfolio weights and reducing some risk is prudent.
S&P Equal Weight & Dividend Stocks – As noted previously, both of these positions have simply gone parabolic as money is chasing yield currently. We have moved up stops and are looking to take profits and rebalance accordingly.
Bonds and REIT’s – We remain long these sectors and did add to them recently on weakness as a hedge against a “risk off” rotation. Our conviction on these positions continue to rise, but we are still honoring our longer-term stop-loss levels.
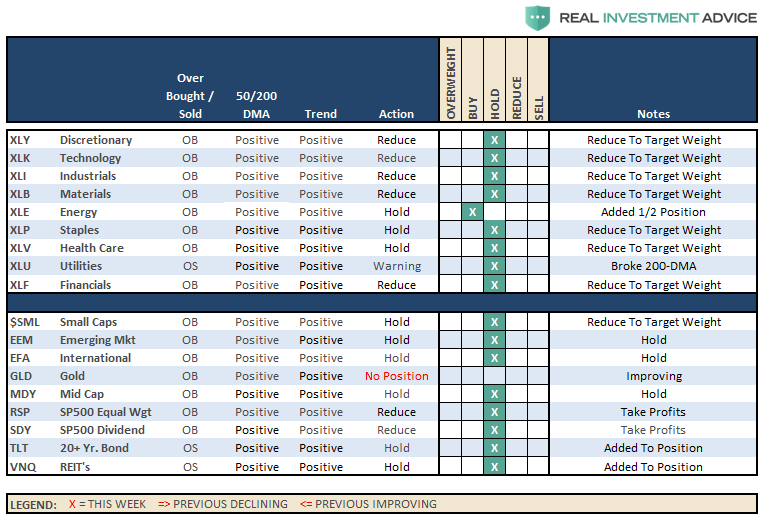
Sector Recommendations:
(These are not recommendations or solicitations to take any action. This is for informational purposes only related to market extremes and contrarian positioning within portfolios. Use at your own risk and peril.)
Portfolio Update:
Also, as noted three weeks ago, hedges have been added to our portfolios given the recent surge in the markets. That has not changed as of this past week. We have:
- Rebalanced positions to target portfolio weights
- Added exposure to bonds, utilities and REIT’s bringing allocations up to portfolio weight.
- Add a tactical trade of a short S&P 500 position to hedge risk.
- Moved up stops on all positions to current support levels.
On our long side, we added a tactical trading position in Energy over a month ago. Our analyst, Jesse Colombo, also found two more good opportunities recently where we increased our exposure to Russell 2000 and Japan on recent breakouts.
While our hedges are taking a bit of a beating as of late, they are small relative to the long-side of our portfolio. As always, we remain fully invested but are becoming highly concerned about the underlying risk. Our main goal remains capital preservation which is why we are de-risking portfolios where and when we can.
THE REAL 401k PLAN MANAGER
The Real 401k Plan Manager – A Conservative Strategy For Long-Term Investors

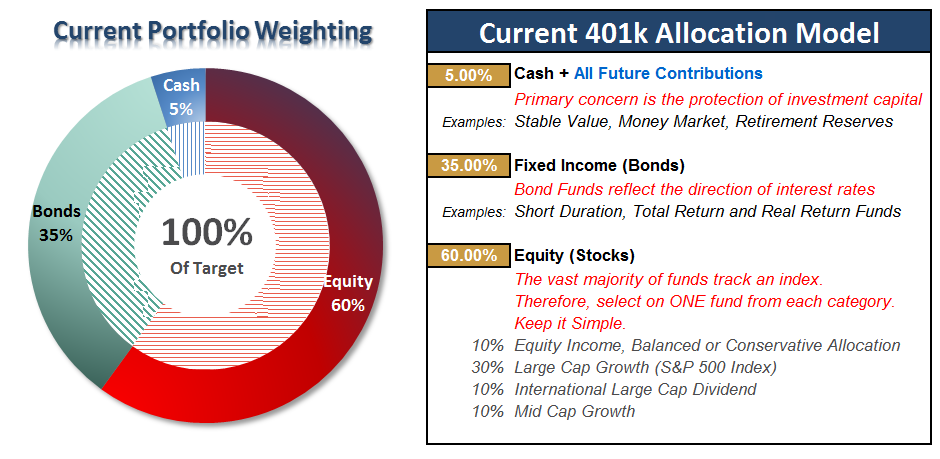
There are 4-steps to allocation changes based on 25% reduction increments. As noted in the chart above a 100% allocation level is equal to 60% stocks. I never advocate being 100% out of the market as it is far too difficult to reverse course when the market changes from a negative to a positive trend. Emotions keep us from taking the correct action.

This Is Even Nuttier – Again…
While portfolio allocations remain at target levels, for now, the time for complacency is now gone.
I have added a couple of notations to the 401k plan manager graph above. The markets have now MASSIVELY pierced the top of the long-term bullish trend channel, which only happens either at the peaks or troughs of a market trend. Secondly, as noted by the arrows, with the markets extremely overbought and extended, risk outweighs reward at this juncture.
Importantly, note the orange horizontal lines I have added in the two bottom buy/sell signal indicators. The market has never been this overbought since I began tracking our model in 2006.(Just for the record, it hasn’t been this overbought since the turn of the century when I began running this model in the newsletter.)
Given the inability to hedge 401k-plans, I continue to recommended rebalancing risks in portfolios by trimming overweight equity exposure and adding to fixed income exposure.
All NEW contributions to plans should currently be adjusted to cash or cash equivalents like a stable value fund, short-duration bond fund or retirement reserves. We will use these funds opportunistically to add to weightings when corrections occur.
If you need help after reading the alert; don’t hesitate to contact me.
Current 401-k Allocation Model
The 401k plan allocation plan below follows the K.I.S.S. principle. By keeping the allocation extremely simplified it allows for better control of the allocation and a closer tracking to the benchmark objective over time. (If you want to make it more complicated you can, however, statistics show that simply adding more funds does not increase performance to any great degree.)
401k Choice Matching List
The list below shows sample 401k plan funds for each major category. In reality, the majority of funds all track their indices fairly closely. Therefore, if you don’t see your exact fund listed, look for a fund that is similar in nature.

Lance Roberts

Lance Roberts is a Chief Portfolio Strategist/Economist for Clarity Financial. He is also the host of “The Lance Roberts Show” and Chief Editor of the “Real Investment Advice” website and author of “Real Investment Daily” blog and “Real Investment Report“. Follow Lance on Facebook, Twitter and Linked-In