by Dana Lyons
The stock of Intel has been a leader in the broad market as well as the semiconductor sector of late; however, it may be facing some chart resistance stemming from past demons.
One of the red hot sectors in recent days, weeks, months and years has been semiconductor stocks. It came into the recent correction as a relative strength leader — and, as noted in a recent post, has emerged from the correction period with that leadership role intact. One of the biggest players in that space is obviously Intel Corp. (INTC). And while the stock has been on a good role of late, it may be running into a bit of a speed bump — or roadblock — on its chart.
For millennials, INTC was one of the high flyers back in the late-1990’s dotcom boom. Of course, it was also one of the poster children for the bubble that burst in 2000. And, like many of its contemporaries, ITNC took a long time to recover from the post-2000 selloff that unfolded. In fact, it is still recovering, as INTC still remains well below its 2000 highs.
It hasn’t been all bad, though, for INTC over the years since bottoming out in 2009. Like the recent period, the stock has enjoyed extensive rallies along the way. It’s just that it has run into periodic resistance over that time. And specifically, the stock has tended to find resistance at key Fibonacci Retracements of its 2000-2009 decline.
After topping out near $75 in 2000, INTC dropped all the way down to $12 at its low in 2009. In early 2012, the stock would reach the 23.6% Fibonacci Retracement of the 2000-2009 decline, near the $27 level. It was promptly rejected there and, in fact, would not exceed the level for more than 2 years.
By late 2014, INTC reached the 38.2% Fibonacci Retracement of the 2000-2009 decline, near $36.40. It was again rejected and was unable to overcome that level for more than 3 years. Finally, this past October, the stock broke out above $36.40 and proceeded to run higher. In the past few days, the stock has arrived at the next, and most important, stop on the Fibonacci path: the 61.8% Retracement, near $51.50.
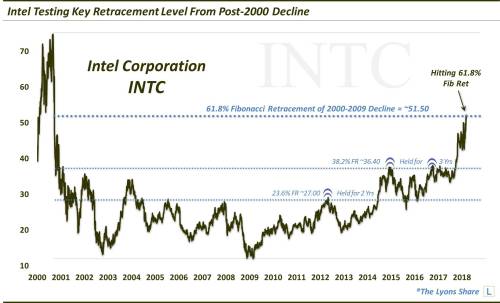
Will Intel be rebuffed at this level as it has been at the previous levels in the Fibonacci Retracement sequence? Once again, we don’t have a crystal ball and there are no guarantees but — that is the trend. And in our experience, 61.8% is the most important and most consistently relevant level to contend with. Thus, it would not surprise us to see INTC struggle at this level for an extended period of time. Furthermore, while the semiconductor sector is more than just one stock, a sputtering Intel would take away one of the important drivers of its recent rally. And while, technically, the semis are still on sound footing, it could make for a more uneven ascent for the sector.