by Dana Lyons

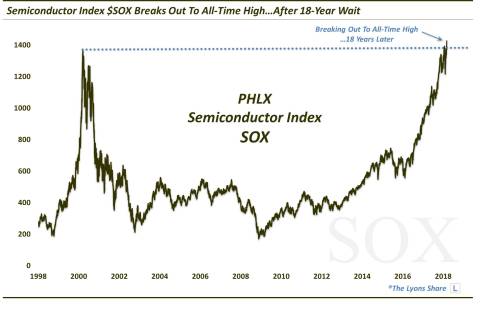
After setting its all-time high during the dotcom bubble, 18 years later — to the day — the PHLX Semiconductor Index is finally scoring a decisive new all-time high.
One factor in convincing us that the correction of the past 6 weeks was not yet the beginning of a serious, longer-term market swoon was the resilience of some of the relative strength leaders in the market. Our philosophy in selecting investments is to concentrate our portfolio in those areas of the market that are performing best. And during the initial decline in early February, we noticed that several of our positions had weathered the decline quite well. Subsequently, these areas continued to shine, both in their buoyancy during the bounce off of the initial correction low as well as in their resilience during the re-test that followed. It has been our observation over the decades that, as long as there is solid demand for something, then a major, imminent market decline is unlikely.
Furthermore, even if a major decline in the major averages is in the works, we are less concerned if the areas of concentration in our portfolio are continuing to rally. Now, that is unlikely to occur within the throes of a serious bear market. However, it has continued to be the case of late. Therefore, we have been less concerned about the potential for a more serious decline.
And we have also been less concerned about the dog fight over the fate of the S&P 500 in recent days as it has gyrated back and forth within a tight range. Based on that index alone, there was a good case for both a deeper re-test of the initial correction lows or a continued bounce toward the late-February highs. However, to us and our clients and subscribers, that mattered very little because, thankfully, we aren’t obligated to exclusively trade the S&P 500. There are thousands of ETF’s and other funds out there to choose from. And there are almost always areas that are out-performing and represent a better investment opportunity than the S&P 500. We point out one such area in today’s Chart Of The Day.
First, a brief history lesson, though. On March 10, 2000, at the height of the dotcom bubble, the PHLX Semiconductor Index (SOX) closed at an all-time high. It immediately crashed and was long unable to approach those highs. Finally, this past November, the SOX was able to claw its way back to its 2000 levels. Over the past 3 and a half months, the index has done what we would want to see it do prior to an attempted breakout above an 18-year old all-time high — it has consolidated. Presumably, this has allowed it to build up enough fuel for a durable breakout, once it was able to decisively top its highs from 2000.
Today, 18 years to the day after its 2000 all-time high (OK, it’s tomorrow, but the market will be closed), the SOX is decisively breaking out above its recent consolidation and its 2000 former highs.
What’s the takeaway? Besides the cool symmetry of the 18-year gap between clear new highs (not to mention this is the 9-year anniversary date of the current bull market low in many areas of the market — that is some voodoo!), it is a reminder of the virtues of relative strength. While the question of detection and execution is always a challenge, there are at all times areas of the market that are leading the way. If one can identify and take advantage of such areas, it can remove the burden of relying on one’s attempts to predict the direction of the next 30-point move in the S&P 500.