Wolf Richter wolfstreet.com, www.amazon.com/author/wolfrichter
Grounded in some sort of new reality? LOL
The S&P 500 stock index edged up to an all-time high of 2,351 on Friday. Total market capitalization of the companies in the index exceeds $20 trillion. That’s 106% of US GDP, for just 500 companies! At the end of 2011, the S&P 500 index was at 1,257. Over the five-plus years since then, it has ballooned by 87%!
These are superlative numbers, and you’d expect superlative earnings performance from these companies. Turns out, reality is not that cooperative. Instead, net income of the S&P 500 companies is now back where it first had been at the end of 2011.
Hype, financial engineering, and central banks hell-bent on inflating asset prices make a powerful fuel for stock prices.
And there has been plenty of all of it, including financial engineering. Share buybacks, often funded with borrowed money, have soared in recent years. But even that is now on the decline.
Share buybacks by the S&P 500 companies plunged 28% year-over-year to $115.6 billion in the three-month period from August through October, according to the Buyback Quarterly that FactSet just released. It was the second three-month period in a row of sharp year-over-year declines. And it was the smallest buyback total since Q1 2013.
Apple with $7.2 billion in buybacks in the quarter, GE with $4.3 billion, and Microsoft with $3.6 billion topped the list again. Still, despite the plunge in buybacks, 119 companies spent more on buybacks than they’d earned in the quarter. On a trailing 12-month basis, 66% of net income was blown on buybacks.
Alas, net income has been a problem. By now, with 82% of the S&P 500 companies having reported their results for Q4 2016, earnings rose 4.6% year-over-year, according to FactSet. It’s the second quarter in a row of year-over-year earnings growth, after six quarters in a row of earnings declines.
For the entire year 2016, earnings edged up 0.4% from 2015. And revenue inched up 2.4% – in a year when inflation, as measured by the Consumer Price Index, rose 2.8%.
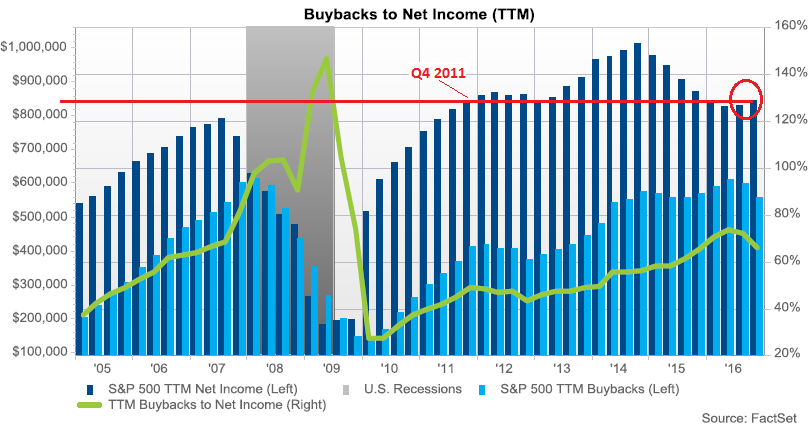
It wasn’t just 2016 that was crummy. Earnings in Q4 2016 were back where they’d been in Q4 2011. This chart by FactSet shows:
- Net income as reported on a trailing 12-month basis (dark-blue bars, left scale in million dollars)
- Share buybacks on a trailing 12-month basis (light blue bars, left scale)
- Buybacks as a percent of net income (green line, right scale).
I added the red line to show how, after a bump in the middle, net income has gone nowhere in five years. And I circled the increases in trailing 12-months net income over the past two quarters to show how puny they’ve been (click to enlarge):
At the same time, over those five years since Q4 2011, the S&P 500 index has soared 87%. Grounded in some sort of new reality? LOL
And it’s even worse. FactSet uses “adjusted” ex-bad-items earnings that companies report under their own metrics. FactSet does not use earnings the companies report under the stricter guidelines of GAAP. These “adjusted” earnings are generally much higher than earnings under GAAP. In some cases, companies might show a big profit on an “adjusted” basis but have a loss under GAAP.
This disconnect between five-year earnings stagnation and soaring stock prices is confirmed by revenues. The S&P 500 price to sales ratio, which tracks stock valuations in relationship to aggregate revenues of the S&P 500 companies, has now reached 1.87, just 8% below its crazy peak back in early 2000 before it all came apart. That ratio was between 1.4 and 1.5 before the Financial Crisis and below 1.0 before 1996 (chart).
The fact that stock valuations in aggregate are levitating beyond the irrational and have lost all grounding in reality does not, however, stop Wall Street from inundating the world with hype. And ultimately, that’s what investors care about; they want their investments to go up no matter what, and they play along willingly. We’ve come to call this phenomenon “consensual hallucination.” It’s only when this consensual hallucination fades that markets begin to swoon, and they can do so abruptly, after having lost their grounding in reality.
Wall Street hocus-pocus truly has done an awesome job. Read… Dow Companies Report Worst Revenues since 2010, Dow Rises to 20,000 (LOL?)