by Dana Lyons

After receiving very little interest in over a year, volume in inverse ETF’s spiked to near record levels yesterday.
Over the past several weeks, we noticed that investor sentiment had relieved a fair amount of its short-term frothy condition. Much of that was based on various measures from the volatility market. One area that had not shown a similar uptick in fear or nervousness was investor flows in the stock market. Folks were still consistently buying the diips, and the rips, and were all but shunning equity-based hedges altogether…until yesterday.
Now there are still some concerning data points related to money flow and a lack of hedging, but when it comes to inverse ETF’s, yesterday saw a long-awaited uptick in interest from traders. Inverse ETF’s, of course, are designed to rise when the stock market falls – and vice versa. Thus, when the market is dropping, we typically notice increased volume in these instruments, signaling an uptick in investor fear.
Using a concept we first saw utilized by Jason Goepfort at www.Sentimentrader.com, we can use volume data from inverse ETF’s as a measure of investor sentiment. When volume spikes, it is a sign of fear, and when it is extremely subdued, it can be a sign of too much complacency.
With the proliferation of ETF interest around the time of the financial crisis, we now have nearly a decade of data with which to utilize for purposes of gauging sentiment. We prefer to measure volume versus total volume on the exchanges to provide a relative standard.
From 2010 to 2016, we found that volume in the inverse ETF group that we track (not a comprehensive group) has averaged about 0.7% of total volume on the NYSE and Nasdaq exchanges, with wider swings in either direction along the way, obviously. Since the beginning of 2017, however, volume in inverse ETF’s has been extremely depressed.
In fact, in 2017 there were just 11 days that saw higher than the historically average (0.7%) level of relative volume in inverse ETF’s. The last 4 months saw exactly 2 days above average. The relative calm, not to mention dearth of stock market losses, led investors to be especially complacent. As we said, though, that changed yesterday.
It took a few days, but the recent bout of weakness has apparently gotten traders’ attention. We say that because yesterday (2/5/2018) saw the 3rd highest volume total ever in inverse ETF’s, as a percentage of total exchange volume, at 2.11%.
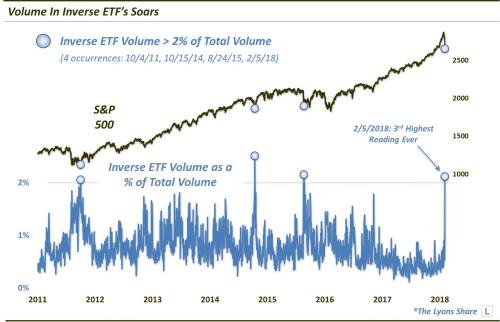
As the chart indicates, just 3 other days in history (10/4/2011, 10/15/2014 and 8/24/2015) have seen at least 2% of exchange volume go to inverse ETF’s. In hindsight, those 3 days were pretty good times to be adding equity exposure. Will this time be the same? There are no guarantees, plus “3? is an incredibly small sample size. However, it is at least encouraging to see some of investors’ complacency beginning to abate.