Even before President Trump’s Asia trip, Chinese 10-year sovereign bond yields have been pushing higher. And that means we should expect the same for U.S. 10-year T-Note yields.
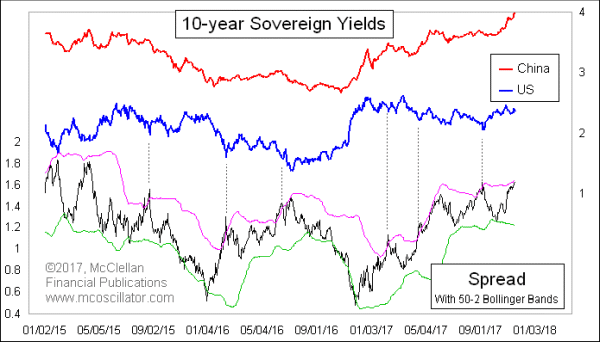
I wrote about this relationship back in May 2017, noting that a big spread between the yields in China and the U.S. can mark an inflection point for U.S. yields. To identify when the spread was getting to an actionable point, I used 50-2 Bollinger Bands. That designation means that the bands are set 2 standard deviations above and below a 50-day moving average. I have left that moving average off the chart just to help reduce visual clutter.
This week, we are again seeing that China-U.S. yield spread poking the upper band, and at its widest value since April 2015. This comes about because the China 10-year yield is pushing 4% and the U.S. yield is remaining basically flat. History says that the widening spread should eventually serve to pull U.S. yields higher.
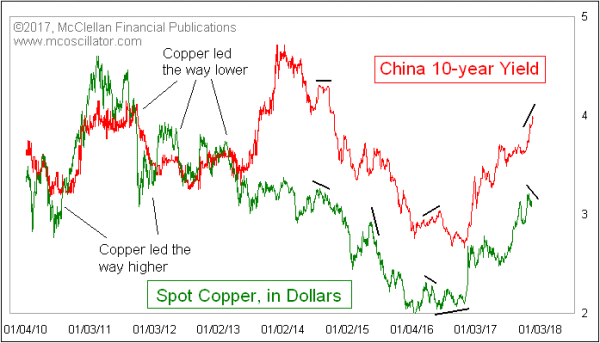
It may not be that long-lasting of a rise in U.S. yields, because there are already signs that the China 10-year yield is outrunning its support. China’s 10-year yield is very closely correlated to the dollar price of copper, but there is a twist in that relationship. Sometimes we will see a divergence or other slight disagreement between copper and the China 10-year yield, and when that happens it is usually copper that ends up being right.

Copper prices peaked back on Oct. 25 and have dropped slightly, even as the China 10-year yield has kept on rising. This is what I mean by saying that the 10-year yield may be outrunning its support.
That does not excuse the U.S. 10-year yield from needing to play catch-up to where China’s yield has already gone. But it does suggest that the catch-up effort may not last that long.
I wrote about this relationship back in May 2017, noting that a big spread between the yields in China and the U.S. can mark an inflection point for U.S. yields. To identify when the spread was getting to an actionable point, I used 50-2 Bollinger Bands. That designation means that the bands are set 2 standard deviations above and below a 50-day moving average. I have left that moving average off the chart just to help reduce visual clutter.
This week, we are again seeing that China-U.S. yield spread poking the upper band, and at its widest value since April 2015. This comes about because the China 10-year yield is pushing 4% and the U.S. yield is remaining basically flat. History says that the widening spread should eventually serve to pull U.S. yields higher.
It may not be that long-lasting of a rise in U.S. yields, because there are already signs that the China 10-year yield is outrunning its support. China’s 10-year yield is very closely correlated to the dollar price of copper, but there is a twist in that relationship. Sometimes we will see a divergence or other slight disagreement between copper and the China 10-year yield, and when that happens it is usually copper that ends up being right.

Copper prices peaked back on Oct. 25 and have dropped slightly, even as the China 10-year yield has kept on rising. This is what I mean by saying that the 10-year yield may be outrunning its support.
That does not excuse the U.S. 10-year yield from needing to play catch-up to where China’s yield has already gone. But it does suggest that the catch-up effort may not last that long.
Tom McClellan
Editor, The McClellan Market Report
