by Umar Farooq
The traders seem to quickly losing faith in the new administration with Dollar wiping out its entire post-election rally and volatility and short bets rising. Investors were anticipating smooth passage of an agenda that featured business-friendly tax cuts and regulatory changes but the idea seems flawed now after the president and Republican legislators failed to proceed with health-care reform Friday.
The Dow Jones Industrial Average DJIA, -0.22% marked its longest losing streak since August 2011 with eight straight declines, closing down 45.74 points Monday, or 0.2%, at 20,550.98, after overcoming an earlier 184-point deficit. It’s looking like tough times for stocks on Monday, while gold and other safety plays are shining. “The markets are having their own ‘Trump tantrum,’ as investors seriously doubt whether the president’s abrasive style will work in Washington,” said Kathleen Brooks, research director at City Index, in a note.
“Although tax reform appears to have broader support and may be easier to pass, the AHCA experience sends investors a cautionary message about opposing factions within the GOP caucus,” Citigroup Inc. analysts wrote, using the abbreviations for the health-care bill and the Republicans.
Here are five charts that indicate all is not well in the markets.
Chart 1: Greenback slides
The dollar, has slumped almost 2 percent in March and is close to erasing a more than 6 percent rally since Trump’s election in November.
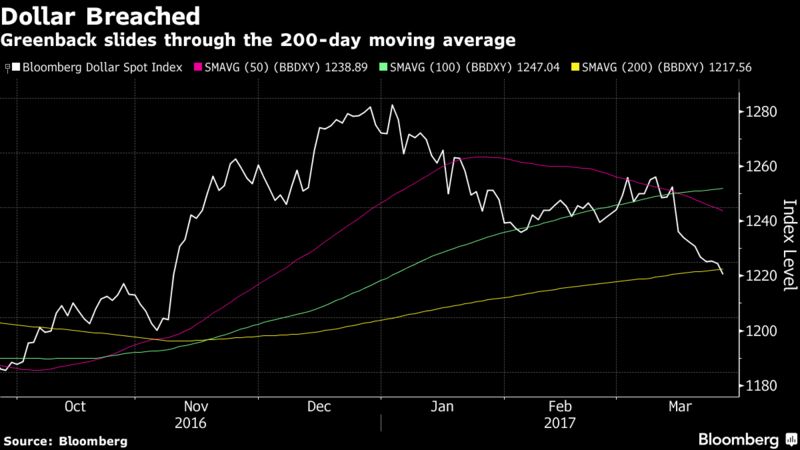
Chart 2: S&P 500 approaches this year VWAP level
The U.S. benchmark S&P 500 is nearing its average price for the year, when measured using mean prices paid by investors. Falling below that level suggests a drop into losing territory.
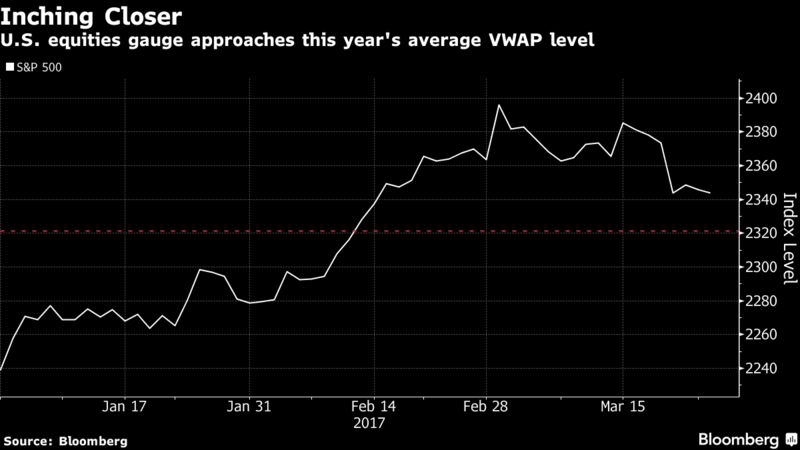
Chart 3: Bears are gathering again
Investors are also boosting short positions on the U.S. benchmark, in anticipation of further losses. Short interest as a percentage of shares outstanding in the SPDR S&P 500 ETF has more than doubled this month, to 2.5 percent, according to data compiled by Markit.
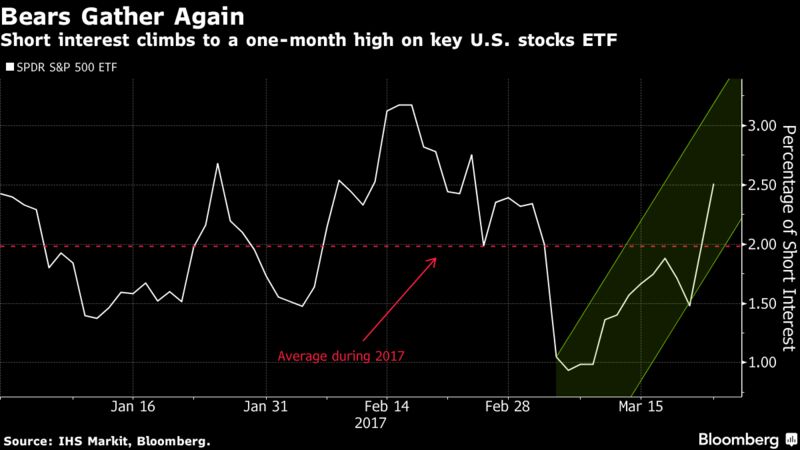
Chart 4: Vix Spikes
The Chicago Board Options Exchange Volatility Index jumped 15 percent last week, the biggest such gain this year, as it became apparent the health-care bill was not going to survive a vote in the House. In Europe, the VStoxx Index rallied 11 percent Monday to the highest level in a month. Even so, overall levels for the VIX remain relatively low compared with the spikes seen last year.
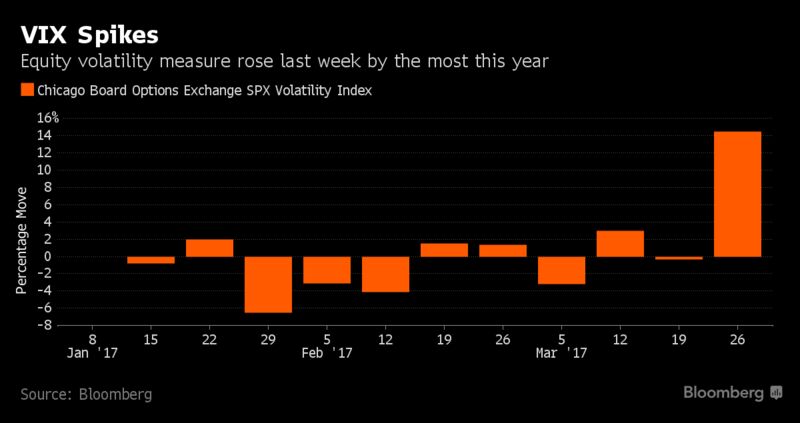
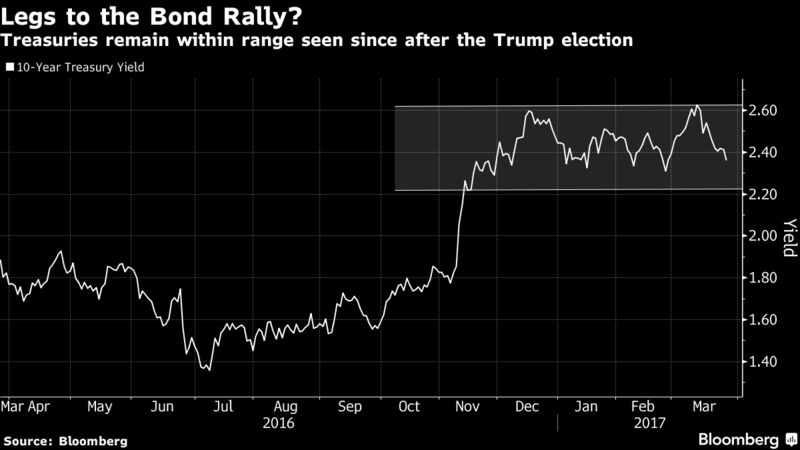
Chart 5: 10 Years Treasury Yield remains in range since election
And while the yield on 10-year U.S. Treasuries has dipped since touching 2.63 percent earlier this month, levels remain in the elevated range seen since the November election.
Five Charts That Indicate The Murky Trade Situation In The U.S. As Alarm Bells Start Ringing Across The Markets
Views: