twitter.com/NorthmanTrader/status/918389272301973504
The $VIX’s corollary, the inverse $XIV, embarked on an explosive near one way journey since the US election coinciding with over $2 trillion central bank intervention in just the first 9 months of 2017…
Tech rally stall? @TgMacro sees investor positioning in the sector at 18 months lows… pic.twitter.com/gxR7690jbc
— Alastair Williamson (@StockBoardAsset) October 12, 2017
“This Is Most Worrying”: In One Year, Central Bank Liquidity Will Collapse From $2 Trillion To Zero
Is it complacency, or simply trader paralysis?
A question we first asked three months ago is getting a second wind this morning, when in a report by Deutsche Bank’s Alan Ruskin – “Vol: freeze or flight?” – the macro strategist points out that “the new 2017 Nobel laureate for Economics is not the only one at a loss to explain low stock market volatility, and thinks investors are in ‘freeze mode’ in the midst of global uncertainties.”
According to Ruskin, however, it’s all about to change.
But why? And what is “the most likely causes of a shift to ‘flight mode’ and a rise in volatility? Here’s one possibility: by the end of next year, the combined expansion of all the major Central Bank balance sheets will have collapsed from a 12 month growth rate of $2 trillion per annum to zero.”

twitter.com/NorthmanTrader/status/918459061494075393
HOUSING CORRECTION, THEN 6-YEAR REFI-BOOM ON DECK?

Make America Great Again Jobs are not being added. Something is terrible wrong… pic.twitter.com/D9blbR8O50
— Alastair Williamson (@StockBoardAsset) October 12, 2017
The US Entitlement Bubble. pic.twitter.com/9DHysi79RC
— Alastair Williamson (@StockBoardAsset) October 12, 2017
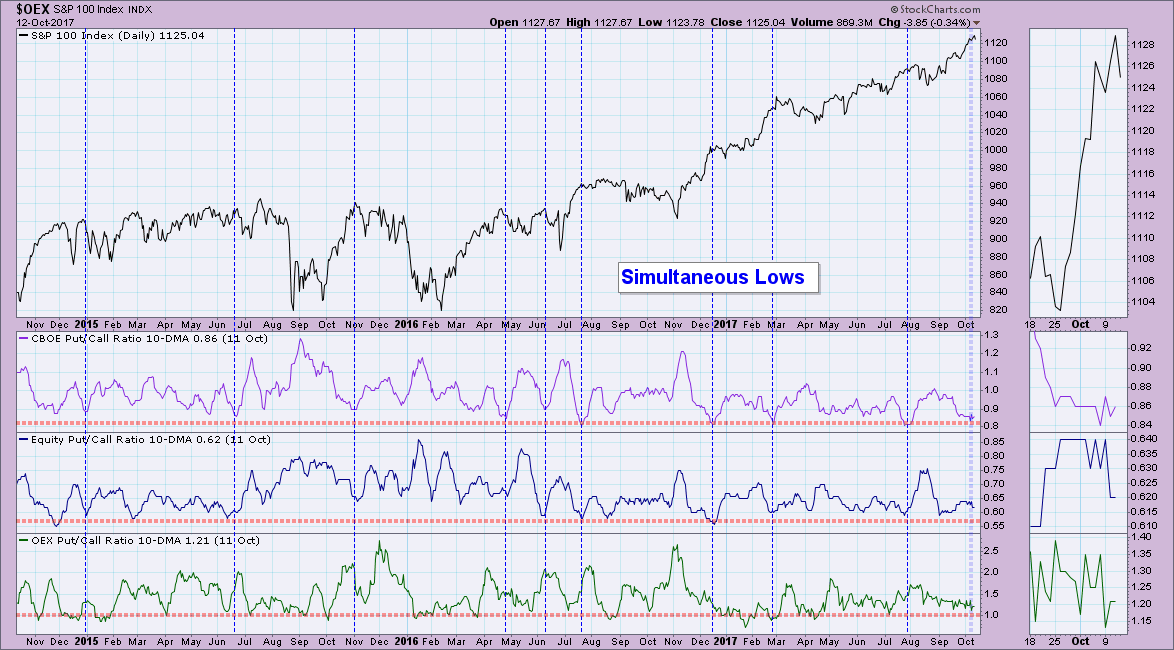
Put/Call Ratios at Simultaneous Lows – Bearish for the Market
but it does suggest an increase in bullishness which is bearish for the market

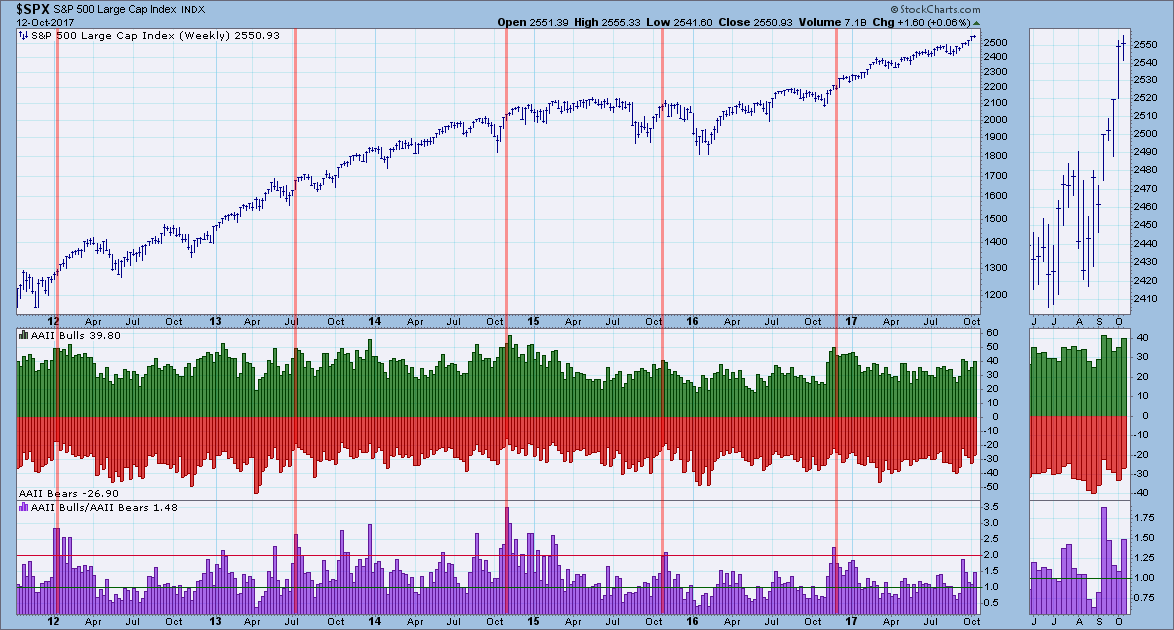
I took a quick peek at the new numbers for the American Association of Individual Investors (AAII) sentiment poll and you can see that the little guys are feeling more bullish which is why the ratio is getting larger. We certainly aren’t looking at bullish extremes on this ratio but it does suggest an increase in bullishness which is bearish for the market.

Conclusion: Let’s face it, it is extremely hard to be bearish in the face of a strong bullish windstorm, but the market is overbought and ready for a longer break or <gasp> a correction. I believe the ratios can get more overbought and in the area of sentiment, more bullish. The AAII chart is clear that while investors are very bullish, the amount of bears isn’t dissipating that quickly.
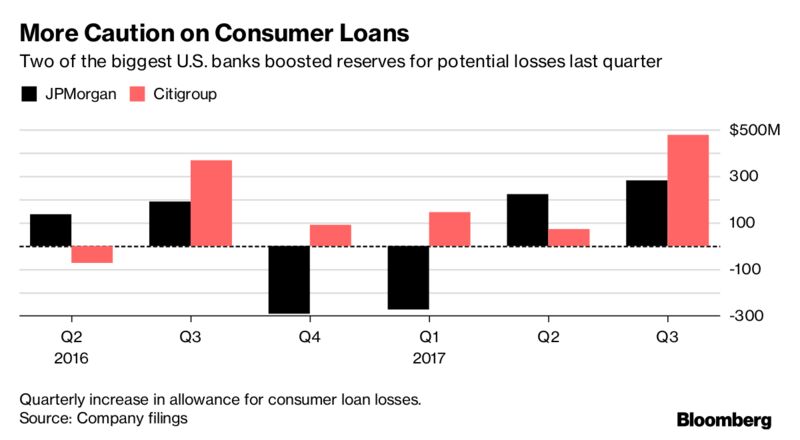
JPMorgan, Citigroup Expect More Credit-Card Users to Fall Behind
“We’re seeing a turn in the sense that the abnormally pristine credit environment has clearly reversed,”

U.K. Banks Tighten Consumer Credit as Defaults Rise
Britain’s consumer borrowing boom may be about to hit a wall.
Charts: The Smart Money & Dumb Money Are Moving in Opposite Directions

While all seems calm in the markets, an interesting trend has emerged underneath the surface.
IMF sounds alert over debt in largest economies
The International Monetary Fund is optimistic about global economic growth. But it sees a new problem: mounting debt in the world’s largest countries.