via businessinsider:
-
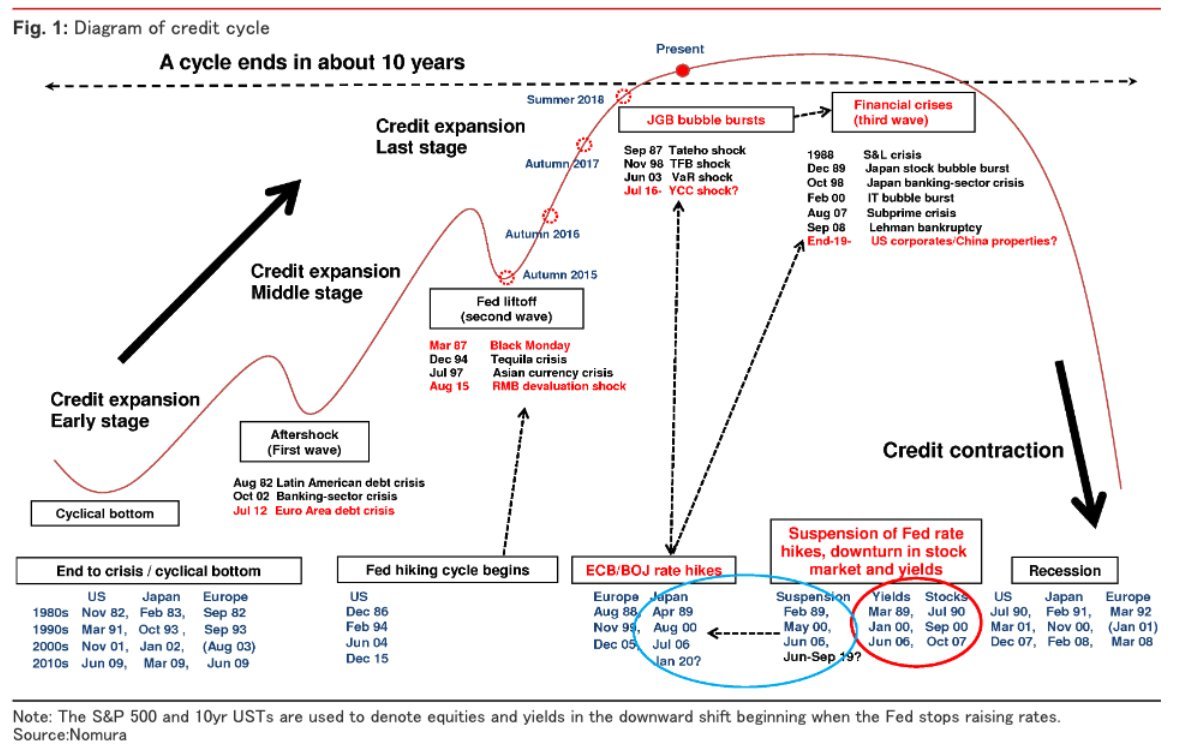
In the life of a decade-long credit cycle, the global economy’s current condition shows it’s firmly heading toward a downturn, according to a new analysis from Nomura.
-
A single cycle is historically a decade long. The beginning is marked by the end of a crisis/a cyclical bottom, and ends when credit contracts and the economy enters into a recession.
-
The global economy today is within what Nomura calls the “credit expansion/last stage,” heading toward a plateau and then a downturn.
One Wall Street strategist warns the end of the global economy’s current cycle is near.
In fact, the path to a downturn is “irreversible,” according to Naka Matsuzawa, chief Japan rates strategist at Nomura.
“The global economy is already on an irreversible path to an economic downturn,” he wrote, in a sweeping report, translated to English from Japanese, about his macro investment strategies for 2019.
“However, we do not expect the economy to fall suddenly into a downturn, but to recover temporarily in the second half of 2019 to the first half of 2020 after signs of a slowdown strengthen through the first half of 2019.”
Matsuzawa’s view is more or less consistent with other experts. Some market strategists and business leaders are not calling for an immediate recession, but think that sometime in 2020 the risks will rise. A recent report from Deutsche Bank placed the likelihood of a recession in the next 12 months as “very low.” Still, economists are keeping an eye on the flattening Treasury yield curve, wherein an inversion traditionally indicates a recession on the horizon — with a mixed track record of reliability.
Nomura defines the lifetime of a credit cycle as a decade-long process beginning with the end of a prior financial crisis and a cyclical bottom that ends when credit contracts and the economy enters into a recession.
6. Leveraged bets on the stock market are starting to unwind… t.co/MKmIYiki2U $SPX $SPY pic.twitter.com/bRgviKvI7c
— Callum Thomas (@Callum_Thomas) December 29, 2018
St. Louis Fed Financial Stress Index rises to the highest level since Feb 2016. Further hikes looks unlikely$TBT $GLD $SLV $SPY $DIA #ForeverQE #USD pic.twitter.com/kEzqSyAFkI
— Fernando M. Pertini (@TweetsMillenia) December 31, 2018
MARKIT iBOXX USD Liquid Leverage Loans Total Return Index versus $SPX — notice the gap? pic.twitter.com/H2UEwDHgRZ
— Alastair Williamson (@StockBoardAsset) December 31, 2018
Most important chart right now. 2 year TIP yield. This is the after inflation yield that an investor can achieve (ie: the real yield) for next two years. For the first time in a decade, this yield is now firmly positive. Tough for risky assets priced for perfection to compete. pic.twitter.com/kTHPcAYAdw
— Kevin Muir (@kevinmuir) December 31, 2018
I am not too well educated on technical analysis – but this chart seems very interesting for 2019
Via @mahaloco pic.twitter.com/tCuFfQEbfD
— OCCUPY WISDOM (@OccupyWisdom) December 30, 2018