Summary
- Household debt levels may not be as menacing as they were in the previous credit boom-bust cycle. On the other hand, corporations have never been as leveraged as they are right now.
- Excesses in corporate credit preceded each of the three previous recessions.
- Ten years ago, one-third (33%) of corporations carried lower-quality ratings of BBB. Right now? 50%.
- The credit cycle has peaked or is extremely close to having done so.
- Household and corporate leveraging on “too-low-for-too-long” monetary manipulation is not likely to avoid negative consequences as the Federal Reserve presses down harder on the brake pads.
(Editor’s Note: Please make sure to check out Gary’s podcast.)
Did seven years of zero percent rate policy, three rounds of quantitative easing (QE) and “Operation Twist” provide a consequence-free credit boom? Or will “too-low-for-too-long” monetary manipulation eventually lead to a credit bust – one with adverse effects for asset prices as well as economic growth?
It is not particularly difficult to understand that the mid-2000s credit expansion became an unsustainable bubble for households. At the pre-crisis peak in the fourth quarter of 2007, household financial obligations as a percent of disposable income had reached an eye-popping 18%. As of July 1, 2017, the American household burden was only 16%. Americans are in much better shape, right?
Unfortunately, borrowing costs have jumped considerably since last year. Tens of millions of consumers who face rising credit card and other variable rate commitments are seeing their household financial obligations as a percent of disposable income climb significantly. And while Americans may not find themselves quite as strained as they were leading into the Great Recession, they may not be in a strong enough position to increase spending dramatically in 2018 and beyond.
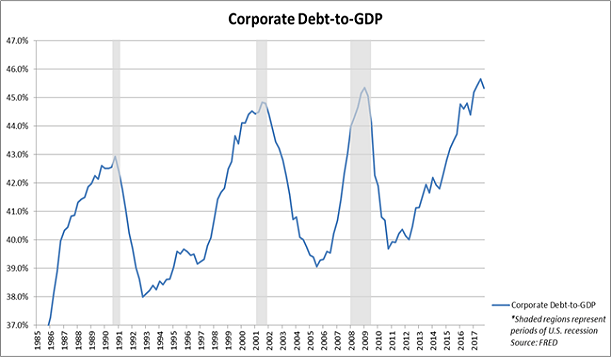
Household debt levels may not be as menacing as they were in the previous credit boom-bust cycle. On the other hand, corporations have never been as leveraged as they are right now. Additionally, excesses in corporate credit preceded each of the three previous recessions.
Consider corporate debt-to-GDP. The late 1980s corporate credit boom gave way to an early 1990s credit bust. The late 1990s corporate credit boom buckled under the pressure of an early 2000s credit bust. And the mid-2000s credit expansion? Corporations were forced to deleverage in response to the financial crisis of 2008.
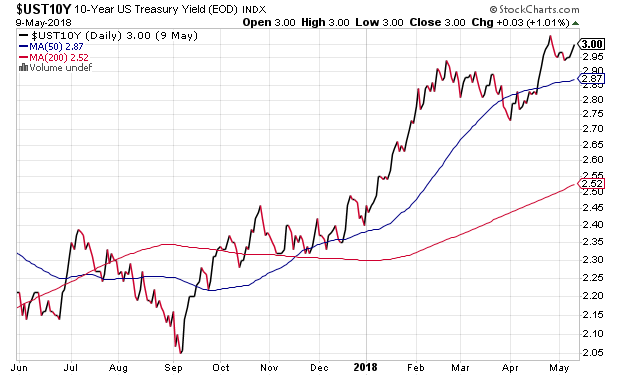
Keep in mind, 200-basis point increases in the 10-year Treasury bond yield marked the peak in each of the aforementioned leveraging booms. In the same vein, a 200-basis point move on this go-around would occur with the 10-year, hitting 3.36%. (Note: The 10-year yield hit its record low of 1.36% in July of 2016).
There is an additional problem when it comes to corporate debt right now: Credit quality. Ten years ago, one third (33%) of corporations carried lower-quality ratings of BBB. Right now? 50%.
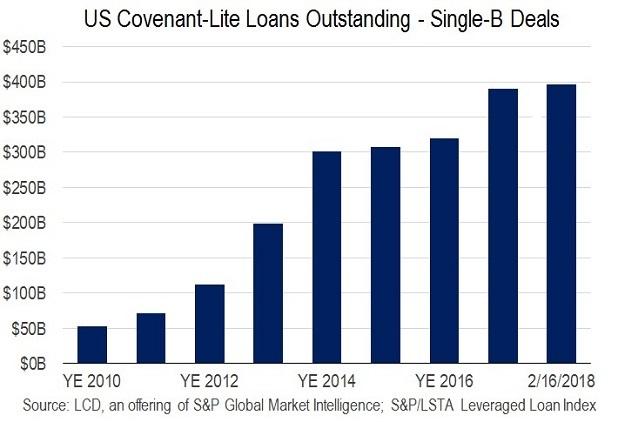
Indeed, credit quality may be even worse than many imagine. Junk-rated single-B debt? Low-rated companies have been able to increase their borrowing by bounds and leaps throughout the nine-year economic recovery.
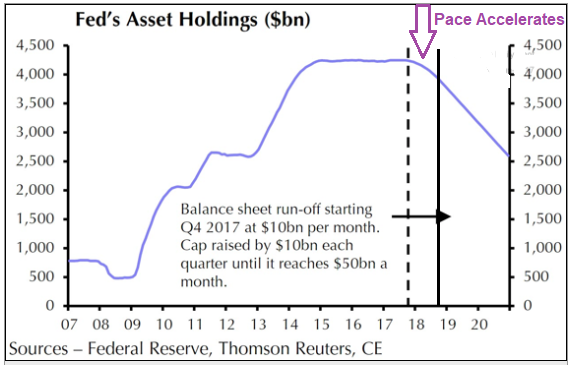
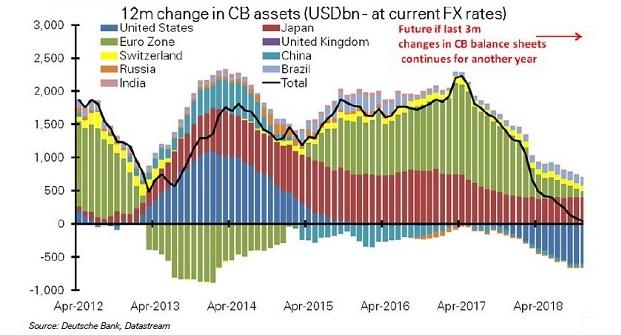
The above-mentioned data points might be less relevant if, in aggregate, global central banks were increasing their collective balance sheets and/or lowering overnight lending rates. Instead, they are either slowing the pace of purchases (a.k.a. “tapering”) or, in the case of the U.S. Federal Reserve, reducing balance sheet size.
The result? Central banks are now becoming a headwind for credit expansion, as borrowing costs continue to rise for corporations.
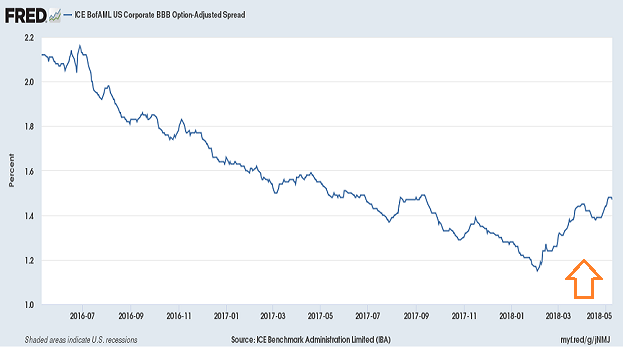
Early warning signs already may be appearing in credit spreads. In a little more than three months, the spread between the median corporate bond (BBB) and the comparable “risk-free” Treasury bond has jumped from 1.16% to 1.47%.
In truth, the bond market is only beginning to come to grips with the Federal Reserve’s quantitative tightening (QT). The Fed is shedding $30 billion per month from its balance sheet in the current quarter, but it will pick up to $40 billion in July and $50 billion in September. Meanwhile, the federal government needs to issue even more Treasury bonds to cover the rising budget deficit.
It follows that the barrage of Treasury supply will exert pressure on shorter-term rates and corresponding borrowing costs. This will be challenging enough for consumers, but may prove even more challenging for hyper-leveraged corporations.
Granted, public companies can funnel tax cut dollars into stock shares. That’s pushing collective earnings per share on the S&P 500 higher. However, year-over-year comparisons for “earnings growth” come back to earth in Q1 of 2019. In the same manner, corporations will still need to refinance maturing debts at significantly higher rates, leaving less money for future buybacks or dividends or capital expenditures.
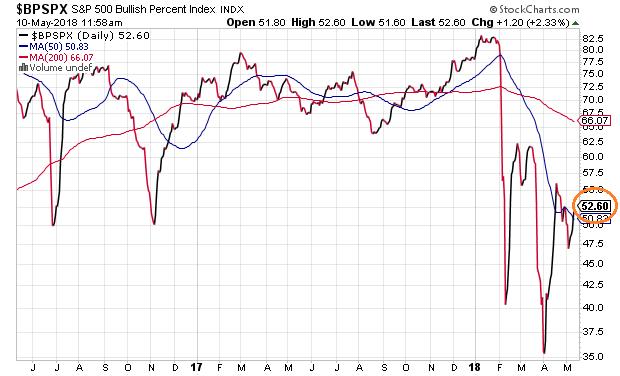
Where is this leaving the stock market itself? In limbo. Approximately half of the S&P 500 components exhibit technical uptrends, while the other half exhibit technical downtrends.
For the bulk of our client base of near-retirees and retirees, we are maintaining our 55-60% allocation to equities, 20-25% allocation to high-quality investment grade credit and 15-25% cash equivalents. That’s down from a more robust allocation of 65% widely diversified stock and 35% widely diversified bond. In addition, we would significantly reduce our risk footprint should the S&P 500’s monthly close fall below its 10-month moving average.
In sum, we believe that the credit cycle has peaked or is extremely close to having done so. Household and corporate leveraging on “too-low-for-too-long” monetary manipulation is not likely to avoid negative consequences as the Federal Reserve presses down harder on the brake pads.
